

Question: 1) Use the table below to trace through a firm's production process to the firm's costs (& per-unit cost curves) to economic profits in a
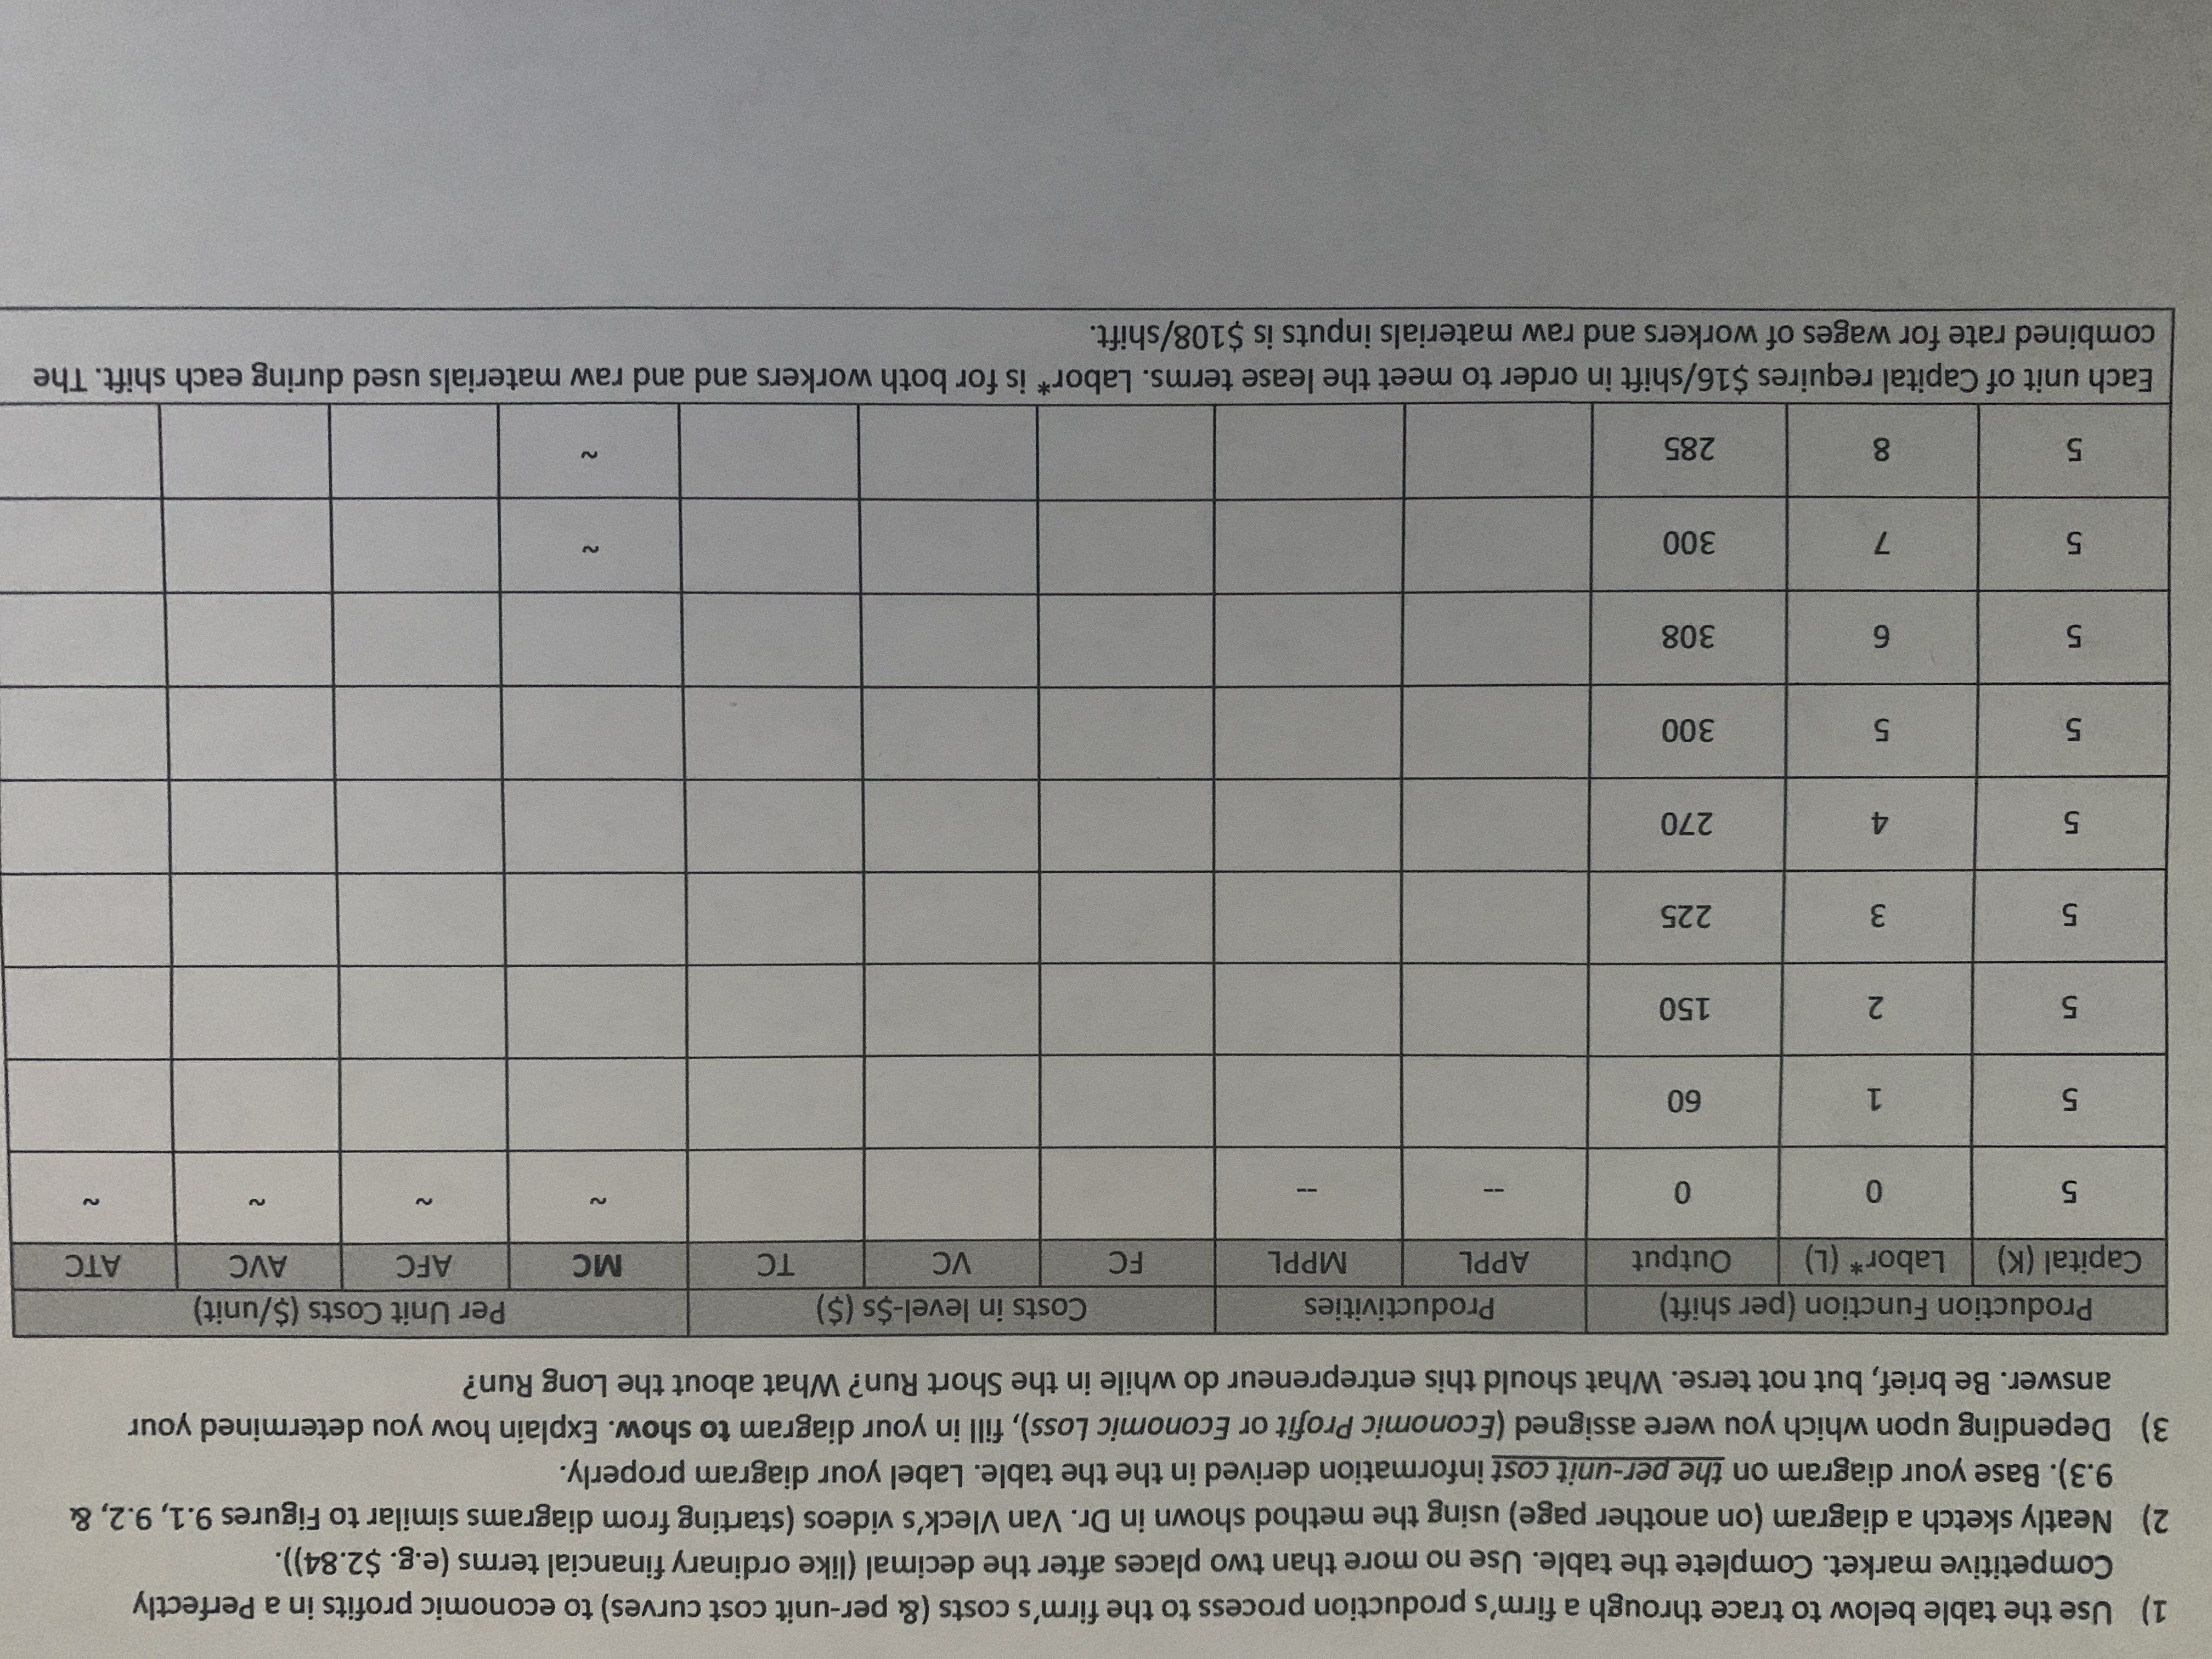

1) Use the table below to trace through a firm's production process to the firm's costs (& per-unit cost curves) to economic profits in a Perfectly Competitive market. Complete the table. Use no more than two places after the decimal (like ordinary financial terms (e.g. $2.84)) 2) Neatly sketch a diagram (on another page) using the method shown in Dr. Van Vleck's videos (starting from diagrams similar to Figures 9.1, 9.2, & 9.3). Base your diagram on the per-unit cost information derived in the the table. Label your diagram properly 3) Depending upon which you were assigned (Economic Profit or Economic Loss), fill in your diagram to show. Explain how you determined your answer. Be brief, but not terse. What should this entrepreneur do while in the Short Run? What about the Long Run? Production Function (per shift) Productivities Costs in level-$s ($) Per Unit Costs ($/unit) Capital (K) Labor* (L) Output APPL MPPL MC AFC AVC ATC 2 O O LO 150 m LO 225 LO 270 300 LC LO 308 300 2 LO 285 Each unit of Capital requires $16/shift in order to meet the lease terms. Labor* is for both workers and and raw materials used during each shift. The combined rate for wages of workers and raw materials inputs is $108/shift
Step by Step Solution
There are 3 Steps involved in it

Get step-by-step solutions from verified subject matter experts