

Question: 1: Use the table to answer the question that follows. ROR Portfolio 1 Portfolio 2 Portfolio 3 3.9% $1,250 $950 $900 1.7% $575 $2,025 $2,350
1: Use the table to answer the question that follows.
| ROR | Portfolio 1 | Portfolio 2 | Portfolio 3 |
|---|---|---|---|
| 3.9% | $1,250 | $950 | $900 |
| 1.7% | $575 | $2,025 | $2,350 |
| 10.6% | $895 | $1,185 | $310 |
| ?3.2% | $800 | $445 | $1,600 |
| 8.1% | $1,775 | $625 | $2,780 |
Calculate the weighted mean of the RORs for each portfolio. Based on the results, which list shows a comparison of the overall performance of the portfolios, from best to worst?
Portfolio 1, Portfolio 3, Portfolio 2
Portfolio 2, Portfolio 3, Portfolio 1
Portfolio 1, Portfolio 2, Portfolio 3
Portfolio 3, Portfolio 2, Portfolio 1
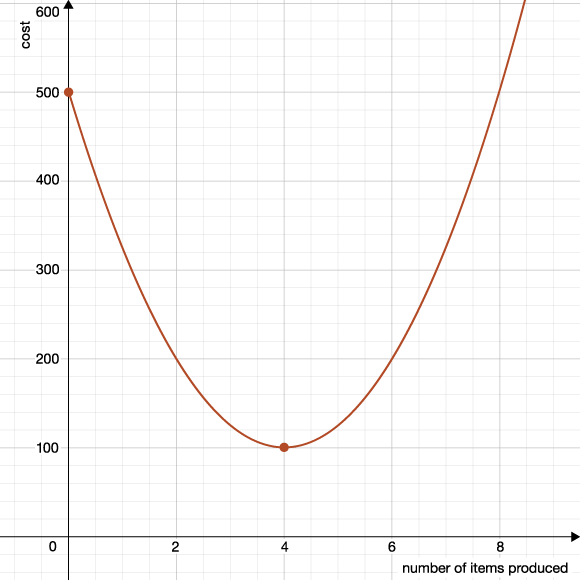
2: A lounge chair manufacturing company's daily production costs, (y), is dependent on the number of lounge chairs (x) produced daily. Use the graph below to answer the question.
Step by Step Solution
There are 3 Steps involved in it
1 Expert Approved Answer
Step: 1 Unlock

Question Has Been Solved by an Expert!
Get step-by-step solutions from verified subject matter experts
Step: 2 Unlock
Step: 3 Unlock