

Question: (Weighted Averages MC) Use the table to answer the question that follows. ROR Portfolio 1 Portfolio 2 Portfolio 3 7.3% $1,150 $800 $1,100 1.8%
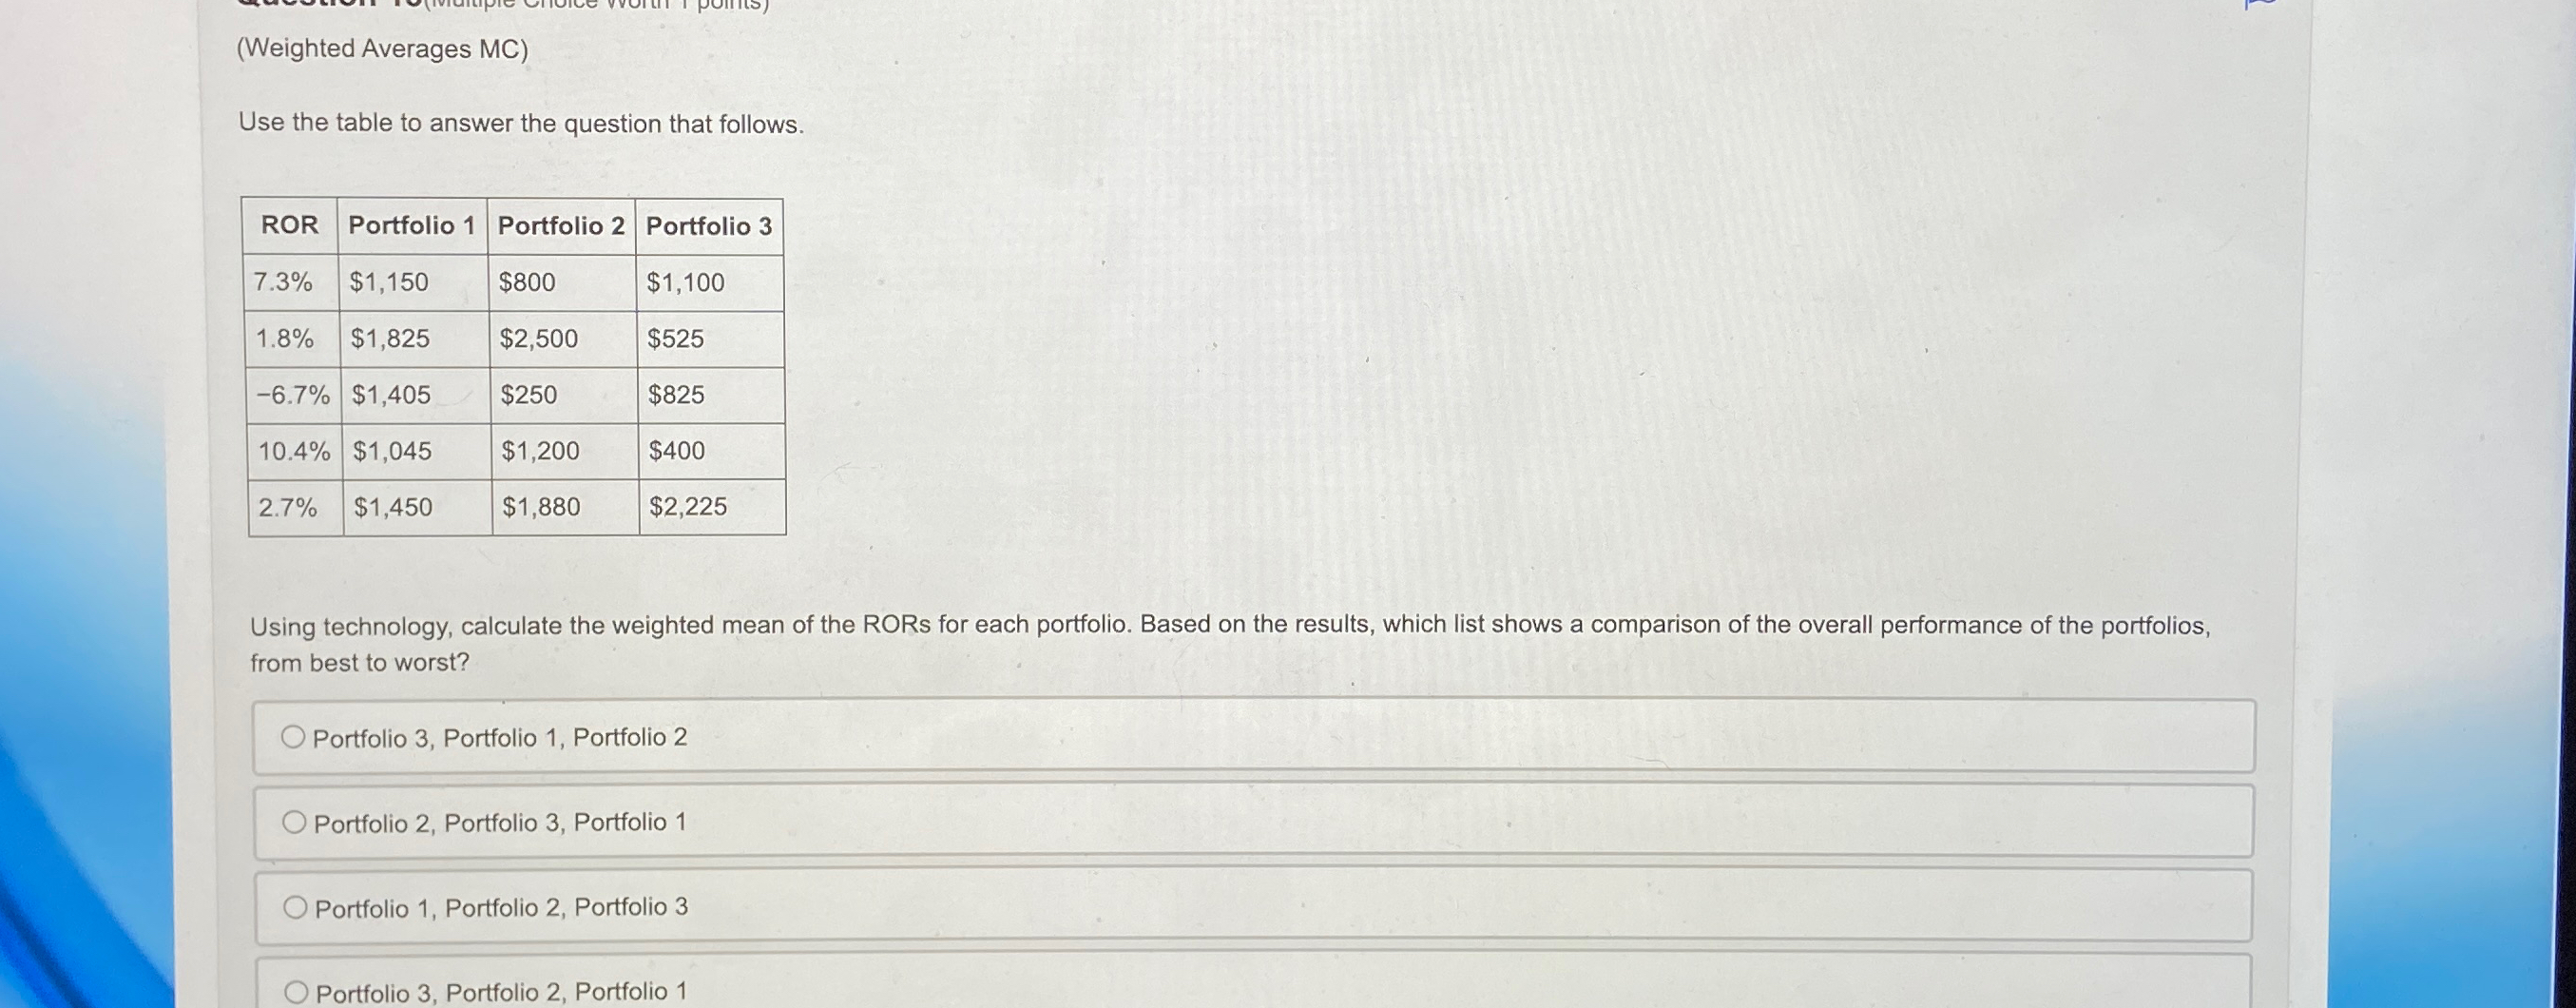
(Weighted Averages MC) Use the table to answer the question that follows. ROR Portfolio 1 Portfolio 2 Portfolio 3 7.3% $1,150 $800 $1,100 1.8% $1,825 $2,500 $525 -6.7% $1,405 $250 $825 10.4% $1,045 $1,200 $400 2.7% $1,450 $1,880 $2,225 Using technology, calculate the weighted mean of the RORs for each portfolio. Based on the results, which list shows a comparison of the overall performance of the portfolios, from best to worst? Portfolio 3, Portfolio 1, Portfolio 2 O Portfolio 2, Portfolio 3, Portfolio 1 O Portfolio 1, Portfolio 2, Portfolio 3 Portfolio 3, Portfolio 2, Portfolio 1
Step by Step Solution
There are 3 Steps involved in it

Get step-by-step solutions from verified subject matter experts