

Question: 1 Use this table to answer question 2 and 3. 2. Draw a Gantt chart that shows the completion times for each process using shortest-job-next
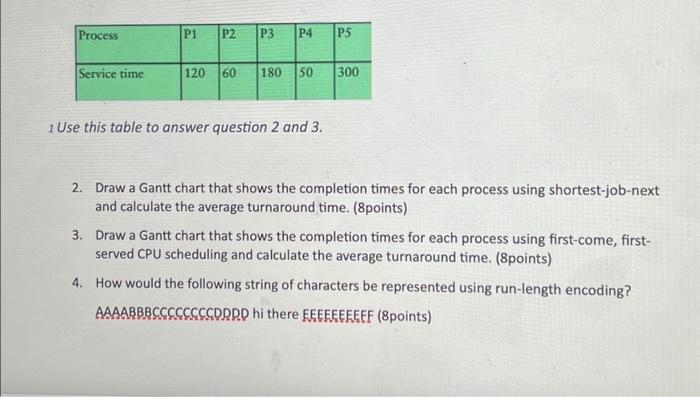
1 Use this table to answer question 2 and 3. 2. Draw a Gantt chart that shows the completion times for each process using shortest-job-next and calculate the average turnaround time. (8points) 3. Draw a Gantt chart that shows the completion times for each process using first-come, firstserved CPU scheduling and calculate the average turnaround time. (8points) 4. How would the following string of characters be represented using run-length encoding? AAAABBBCCCCCCCCDDDD hi there EEEEEEEEFF (8points)
1 Use this table to answer question 2 and 3. 2. Draw a Gantt chart that shows the completion times for each process using shortest-job-next and calculate the average turnaround time. (8points) 3. Draw a Gantt chart that shows the completion times for each process using first-come, firstserved CPU scheduling and calculate the average turnaround time. (8points) 4. How would the following string of characters be represented using run-length encoding? AAAABBBCCCCCCCCCDDDD hi there EEEEEEEEEF (8points)
Step by Step Solution
There are 3 Steps involved in it
1 Expert Approved Answer
Step: 1 Unlock

Question Has Been Solved by an Expert!
Get step-by-step solutions from verified subject matter experts
Step: 2 Unlock
Step: 3 Unlock