

Question: 1. Use vertical analysis to compare profitability. Perform Vertical Analysis - Excel. FILE HOME INSERT PAGE LAYOUT FORMULAS DATA REVIEW VIEW Paste Clipboard Calibri
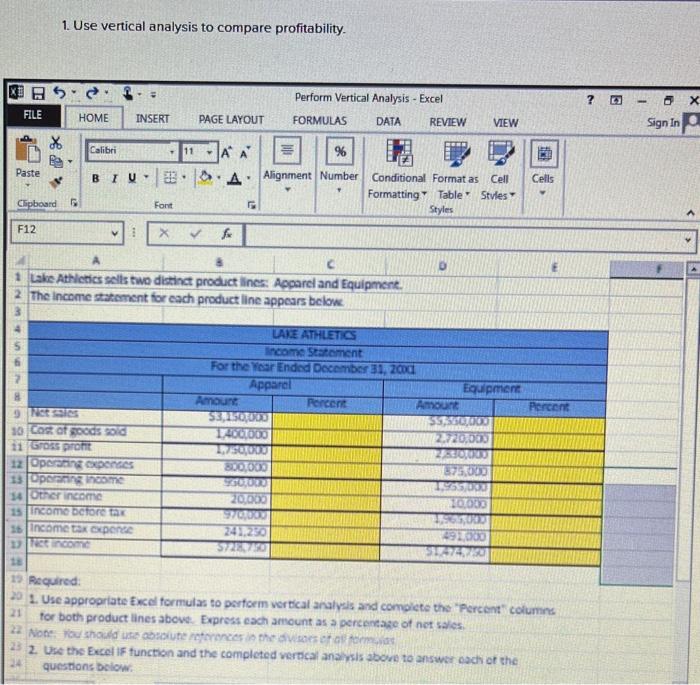
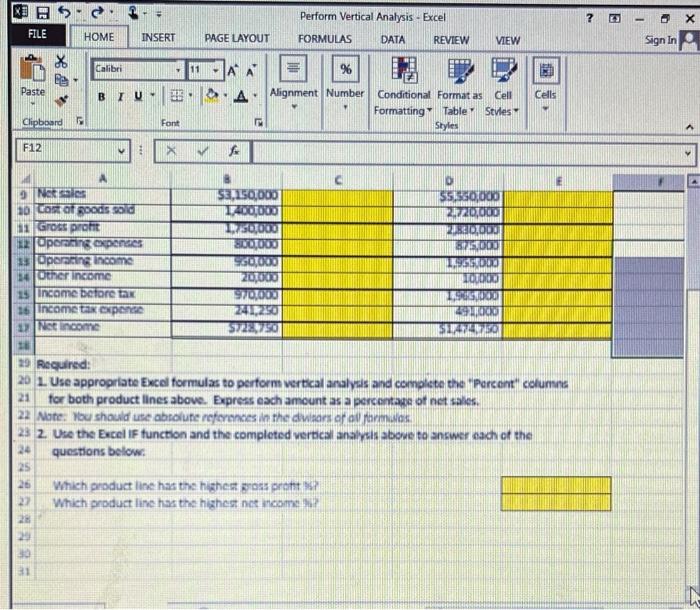
1. Use vertical analysis to compare profitability. Perform Vertical Analysis - Excel. FILE HOME INSERT PAGE LAYOUT FORMULAS DATA REVIEW VIEW Paste Clipboard Calibri 11 AA % BIU EB A Alignment Number 2 Font G Conditional Format as Cell Formatting Table Styles Styles Cells F12 v X fe A 8 D 1 Lake Athletics sells two distinct product lines: Apparel and Equipment 2 The Income statement for each product line appears below LAKE ATHLETICS Income Statement For the Year Ended December 31, 2001 Apparel Amount 9 Not sales 10 Cost of goods sold 11 Gross profit 12 Operating expenses $3,150,000 1,400,000 1,750,000 800,000 13 Operating Income $60,000 14 Other income 20.000 15 Income before tax 970,000 16 Income tax expense 241,250 17 Net income $728,750 18 15 Required: Percent Equipment Amount Percent $5,560,000 2,720,000 2,830,000 875,000 1,965,000 10,000 491,000 ST474,75 201. Use appropriate Excel formulas to perform vertical analysis and complete the "Percent" columns 21 for both product lines above. Express each amount as a percentage of net sales. 22 Note: You should use absolute references in the divisors of all formulas 23 2. Use the Excel IF function and the completed vertical analysis above to answer each of the 24 questions below. 3 Sign In
Step by Step Solution
There are 3 Steps involved in it

Get step-by-step solutions from verified subject matter experts