

Question: 1. Using a spreadsheet app, plot pj vs p; for all 20 runs of this experiment, including both Part A and Part B. Fit
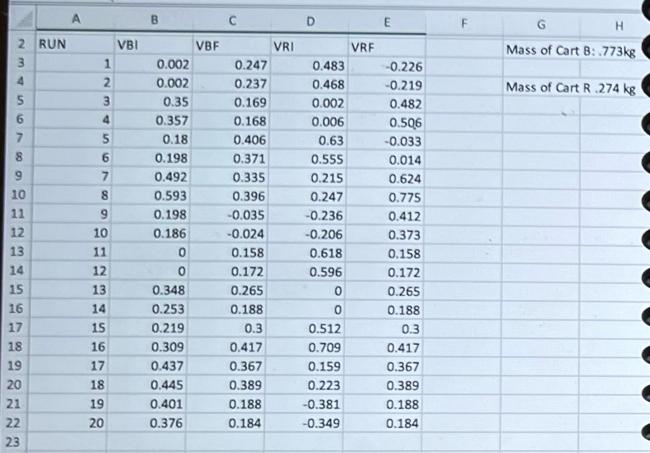
1. Using a spreadsheet app, plot pj vs p; for all 20 runs of this experiment, including both Part A and Part B. Fit a line to the data, and show the slope on the graph. Attach the graph to your lab report. (8 pts.) 2. Using a spreadsheet, plot K, vs K, for just the data from Part A. Fit a line to the data, and show the slope on the graph. Attach this graph to your lab report. (8 pts.) 3. What should the slope of the graph for #1 above be? Why? If the slope of your graph is not what you expect, comment on the possible sources of error. (8 pts.) 23456780 2 RUN 9 10 11 12 13 14 15 16 17 18 19 20 21 22 23 1 2 3 4 5 6 7 8 9 10 11 12 13 14 15 16 17 18 19 20 VBI B 0.002 0.002 0.35 0.357 0.18 0.198 0.492 0.593 0.198 0.186 0 0 0.348 0.253 0.219 0.309 0.437 0.445 0.401 0.376 VBF 0.247 0.237 0.169 0.168 0.406 0.371 0.335 0.396 -0.035 -0.024 0.158 0.172 0.265 0.188 0.3 0.417 0.367 0.389 0.188 0.184 VRI D 0.483 0.468 0.002 0.006 0.63 0.555 0.215 0.247 -0.236 -0.206 0.618 0.596 0 0 0.512 0.709 0.159 0.223 -0.381 -0.349 VRF E -0.226 -0.219 0.482 0.506 -0.033 0.014 0.624 0.775 0.412 0.373 0.158 0.172 0.265 0.188 0.3 0.417 0.367 0.389 0.188 0.184 F H Mass of Cart B:.773kg Mass of Cart R.274 kg
Step by Step Solution
There are 3 Steps involved in it

Get step-by-step solutions from verified subject matter experts