

Question: 1 using data to plot the time in minutes ( X-Axis)vs. Absorbance reading at 410 nm (Y-Axis) using excel2-Draw the best straight line all data

1 using data to plot the time in minutes ( X-Axis)vs. Absorbance reading at 410 nm (Y-Axis) using excel2-Draw the best straight line all data points 3- Explain your results among times and Absorbance readings4-Does your results represent zero, first or second order reaction? Provide your evidence
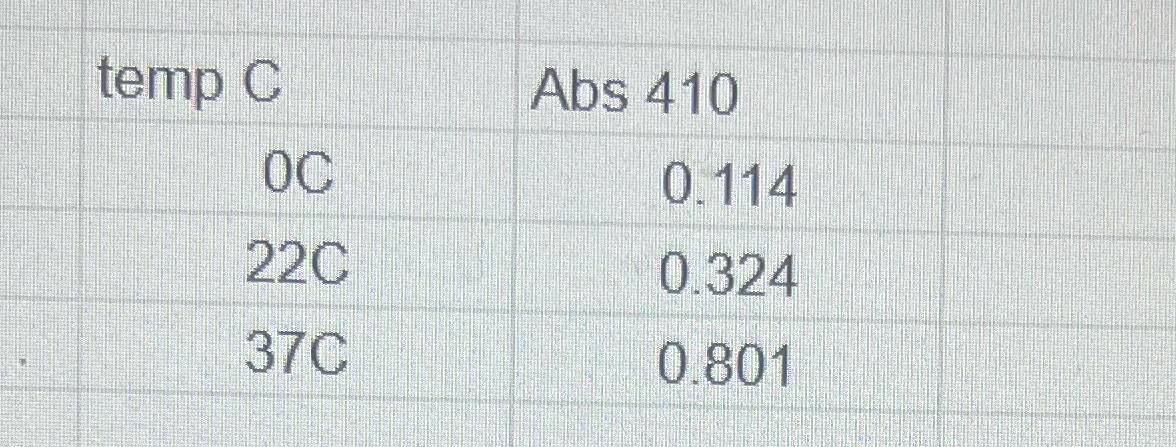
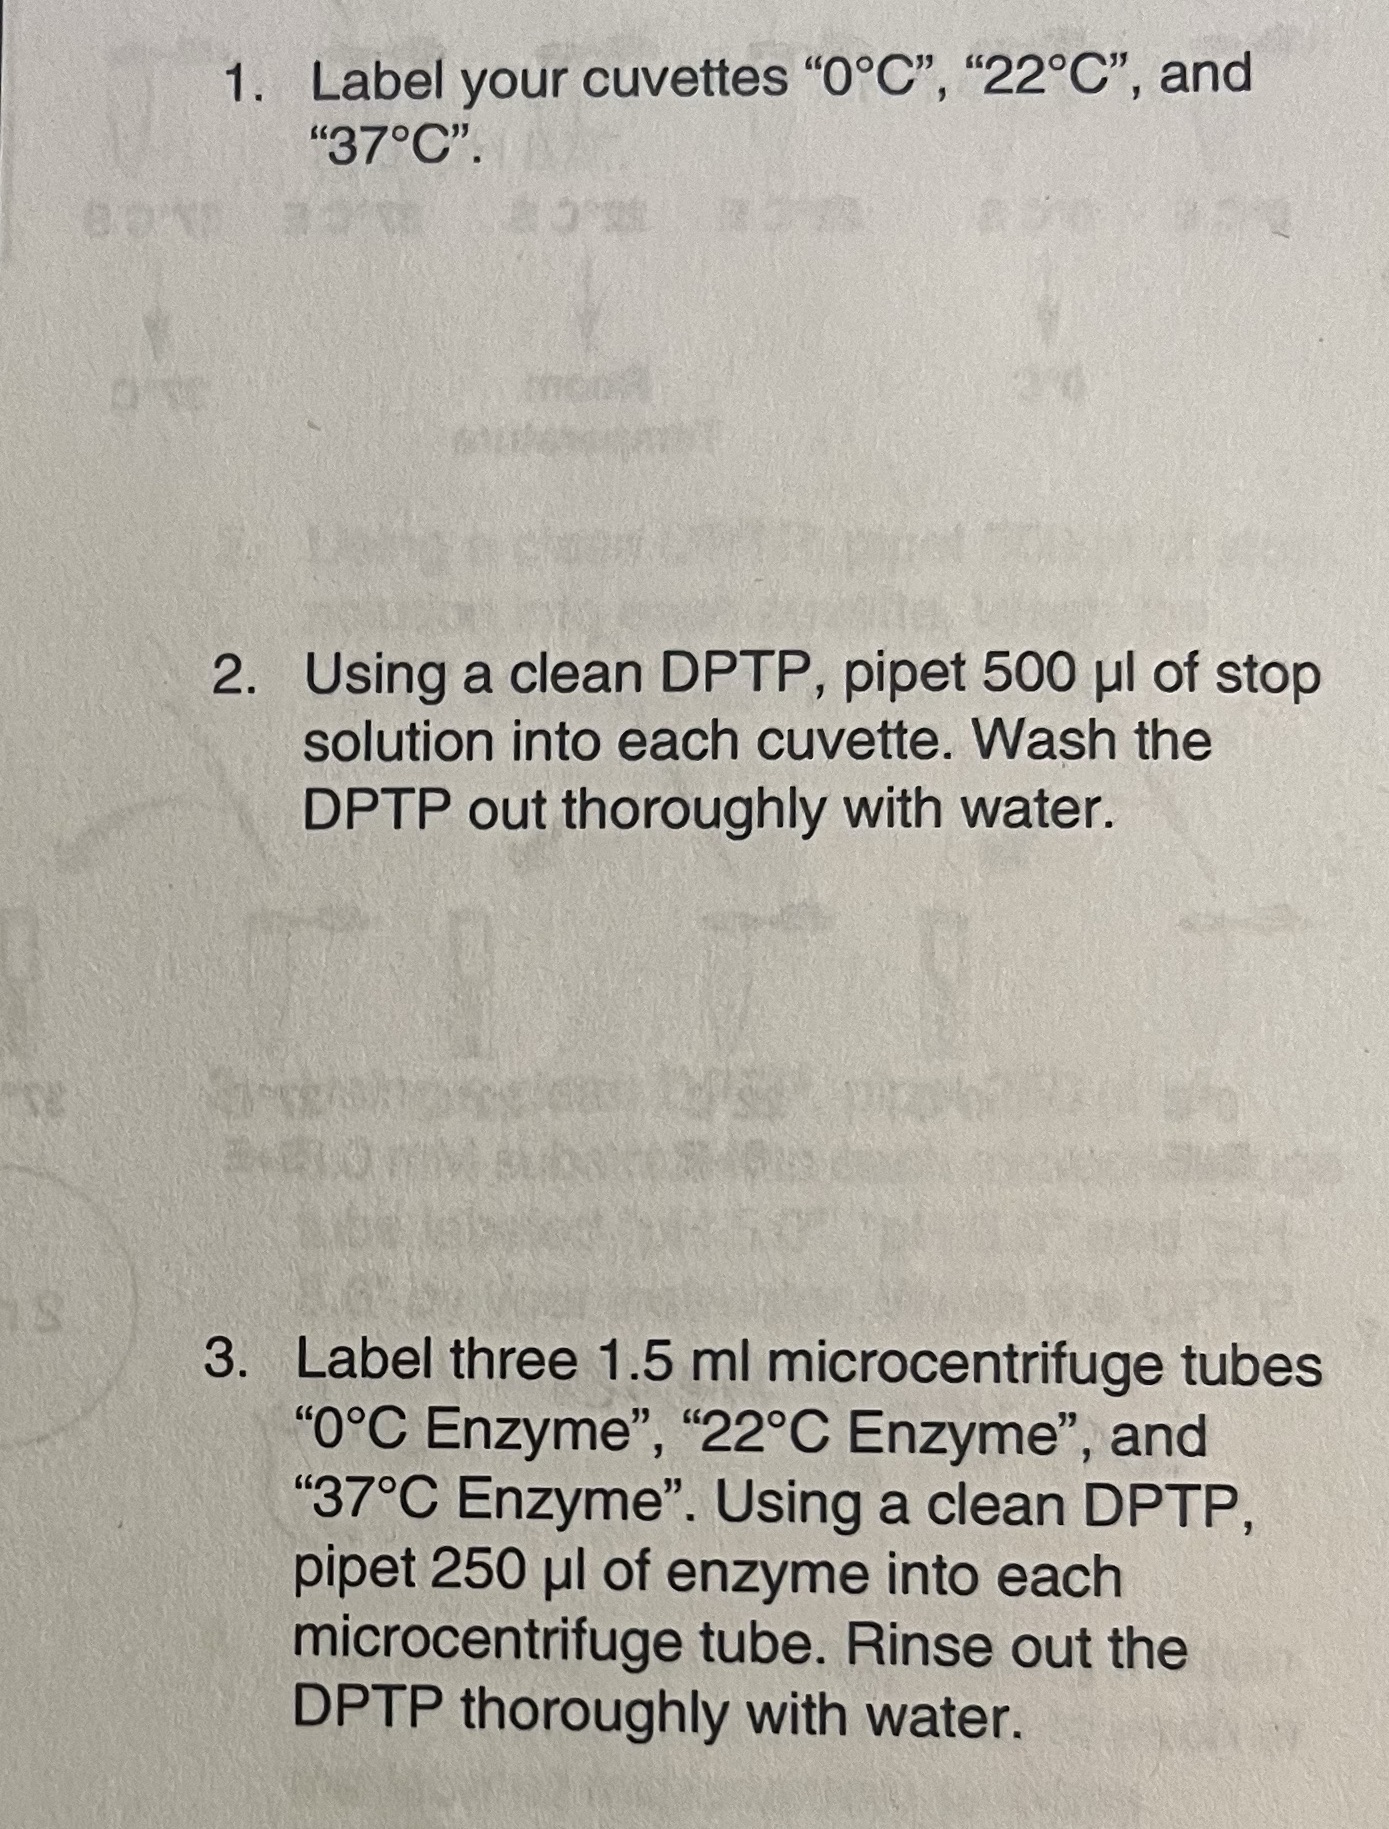
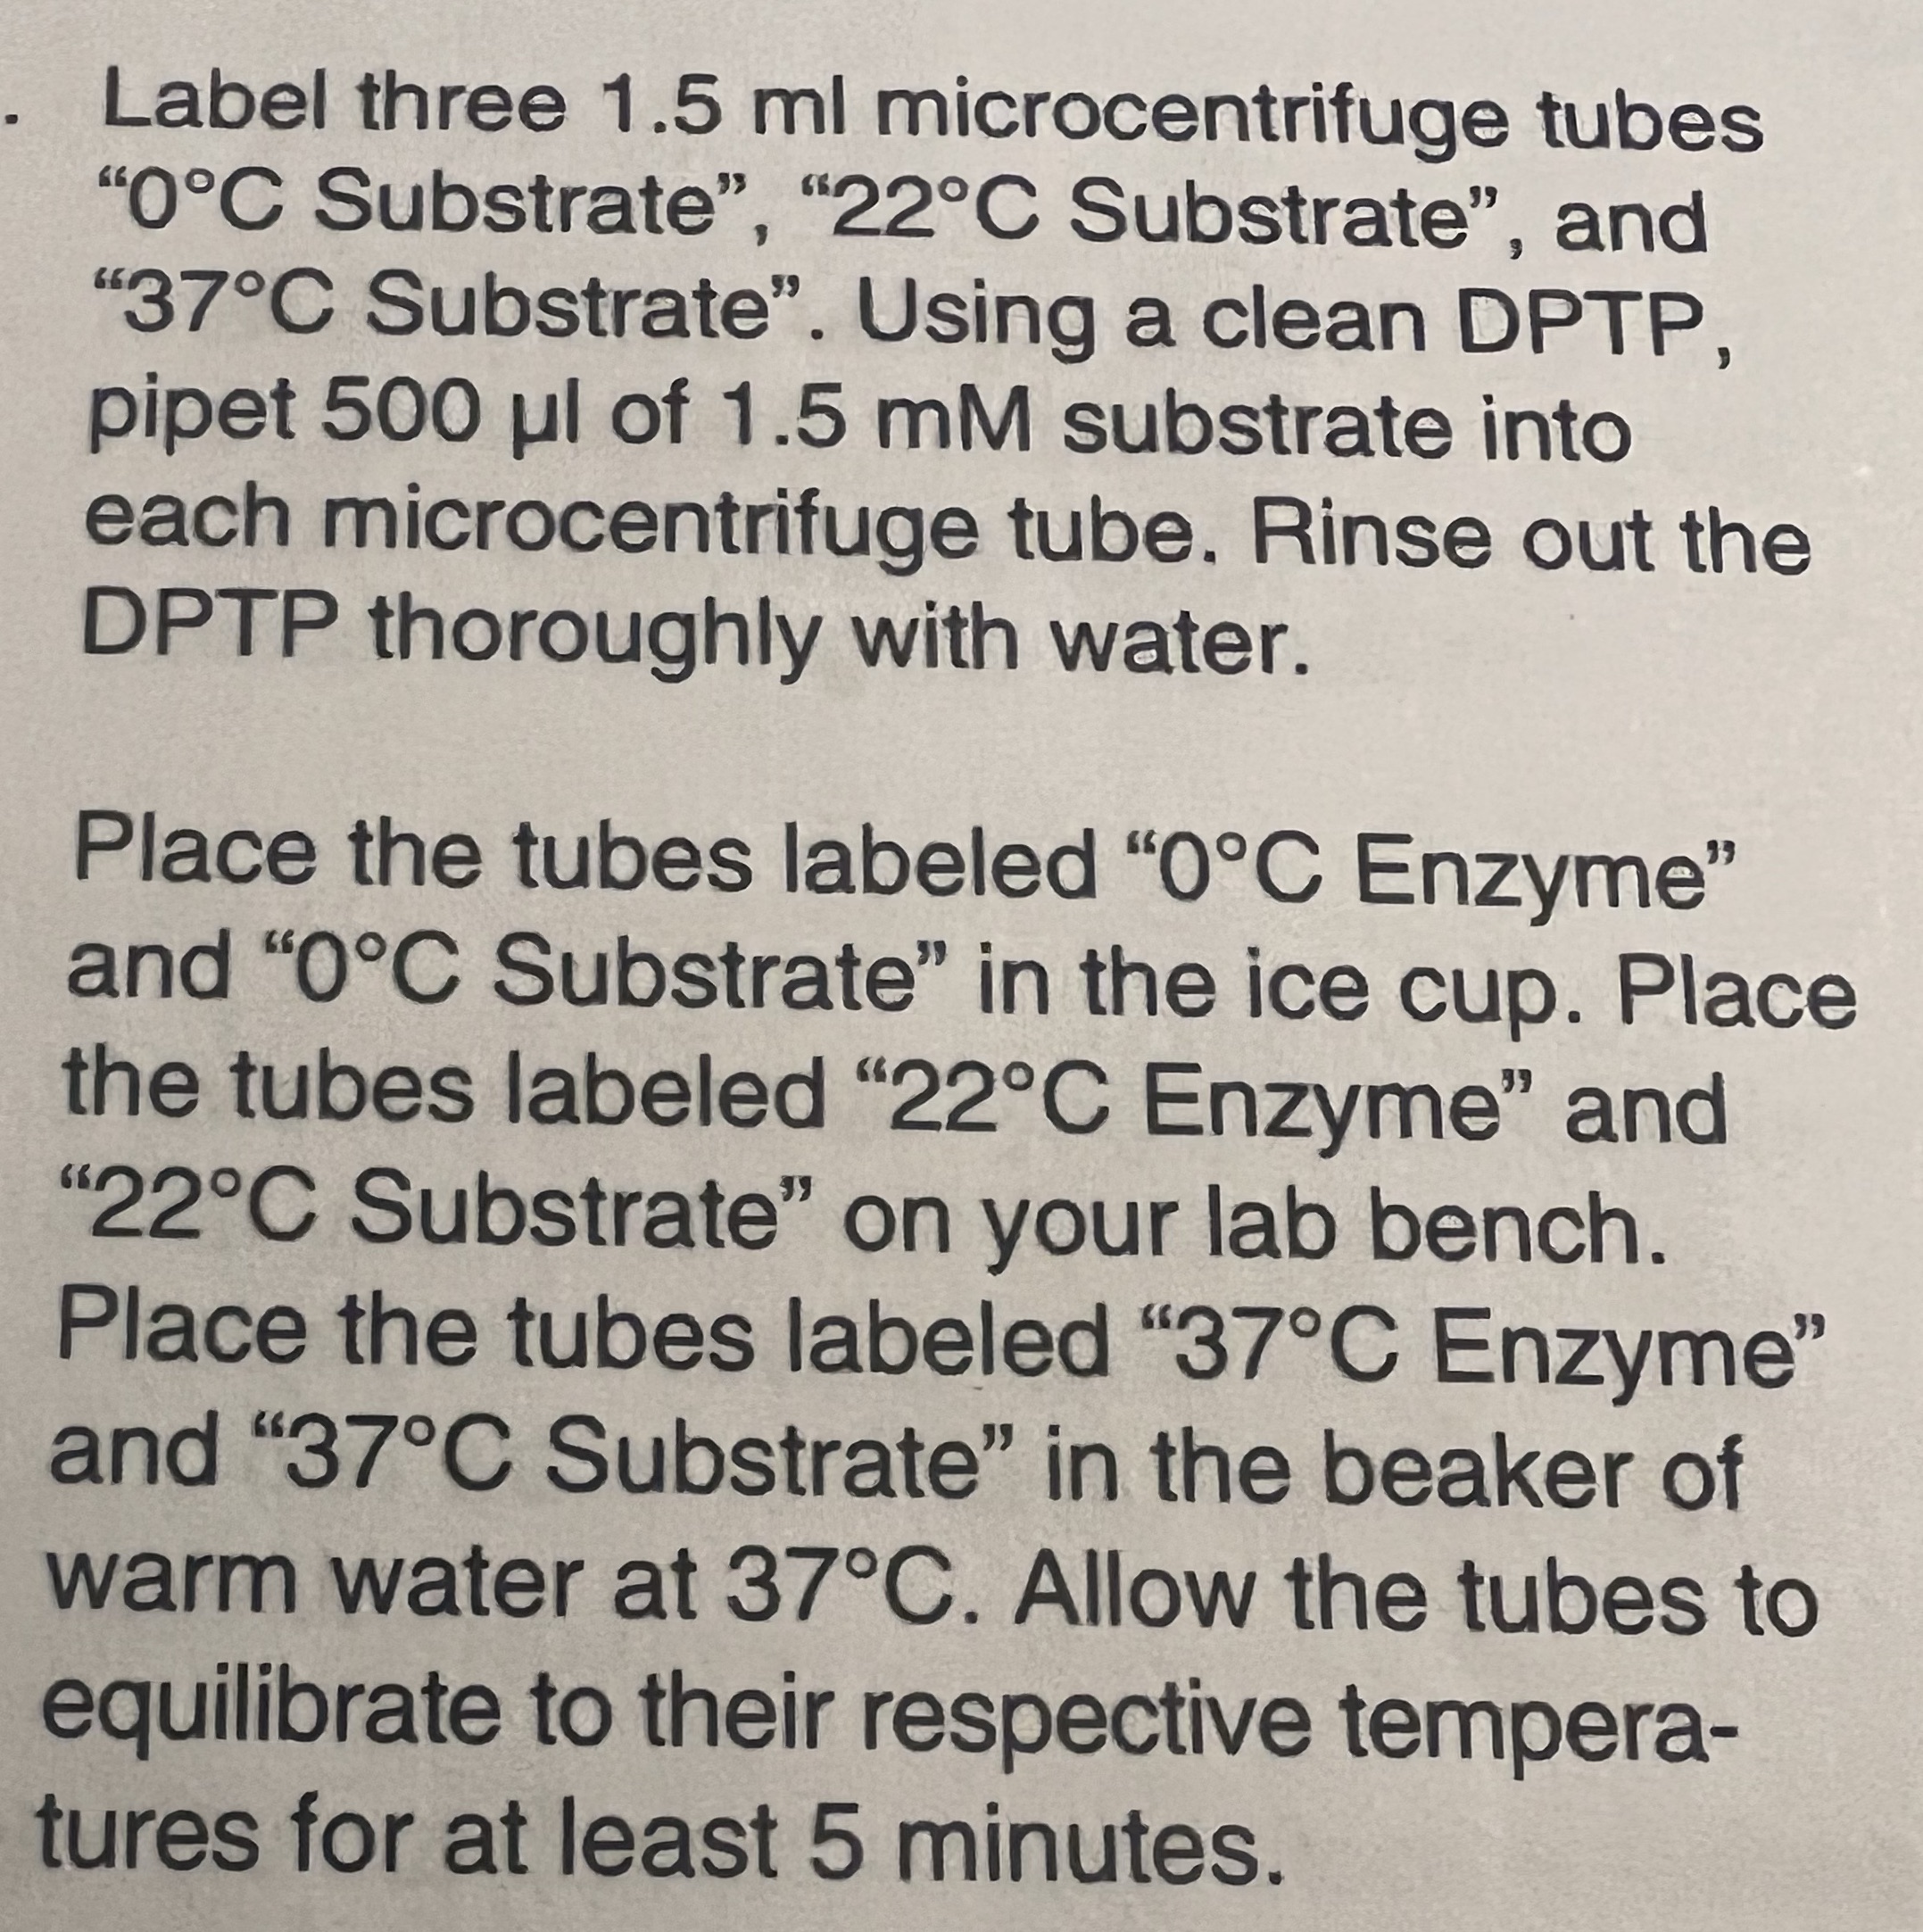
temp C Abs 410 OC 0. 114 220 0.324 370 0.8011. Label your cuvettes "OC", "22C", and "37" C". 2. Using a clean DPTP, pipet 500 ul of stop solution into each cuvette. Wash the DPTP out thoroughly with water. 3. Label three 1.5 ml microcentrifuge tubes "OC Enzyme", "22C Enzyme", and "37.C Enzyme". Using a clean DPTP, pipet 250 ul of enzyme into each microcentrifuge tube. Rinse out the DPTP thoroughly with water.. Label three 1.5 ml microcentrituge tubes \"0C Substrate\
Step by Step Solution
There are 3 Steps involved in it

Get step-by-step solutions from verified subject matter experts