

Question: Report Sheet - Data from part A will be used to plot a caltration curve. Absorbance vs IFo(SCN7-7. - Calibration curve data will be used
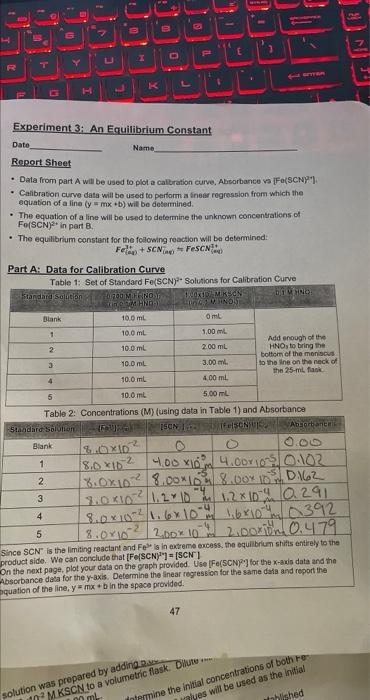
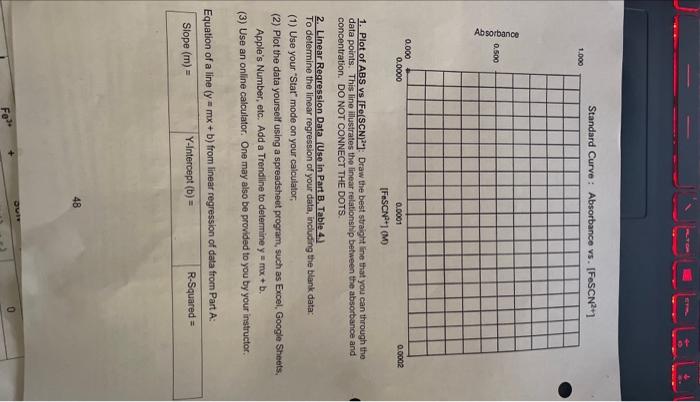
Report Sheet - Data from part A will be used to plot a caltration curve. Absorbance vs IFo(SCN7-7. - Calibration curve data will be used to perform a finear regression from which the equation of a line (y=mx+b) will bo determined. - The equation of a line will be used to determine the unknown concentratiens of Fo(sCN) 2+ in part B. - The equilibrium constant for the following roaction will bo detormined: Part A: Data for Calibration Curve Table 1: Set of Standard Fe(SCN)- Solutions for Calibration Curve Since SCN is the limiting reactant and Fe2/I in weceme product side. We can conclude that [Fe(SCN)17]=[SCN] product sido. We can the noxt page, plot your data on the graph provided. USe [Fe(5CN]?] for the x-axis data and tha Absorbance dala for the y-axis. Determine the linear regression far the same data and report the pquation of the line, y=mx+b in the space provided. 47 solution was prepared by addinge tric flask. 402MKSCN to a volum 1. Plot of ABS vs [Fe(SCN) 2+. Draw the best straight line that you can through tho data points. This line iilustrates the linear relationship between the absorbance and concentration. DO NOT CONNECT THE DOTS. 2. Linear Regression. Data (Uso in.Part B. Table 4.). To determine the linear regression of your data, including the blank data: (1) Use your "Stat" mode on your calculator, (2) Plot the data yourseif using a spreadsheet program, such as Excel, Google Sheets. Apple's Number, etc. Add a Trondline to determine y=mx+b. (3) Use an online calculator. One may also be provided to you by your instructer, Equation of a line (y=mx+b) from linear regression of data from Part A
Step by Step Solution
There are 3 Steps involved in it

Get step-by-step solutions from verified subject matter experts