

Question: 1. Using initialization lists, create 2 arrays to hold the normal rainfall amounts (based on an average of the last 30 years data for that
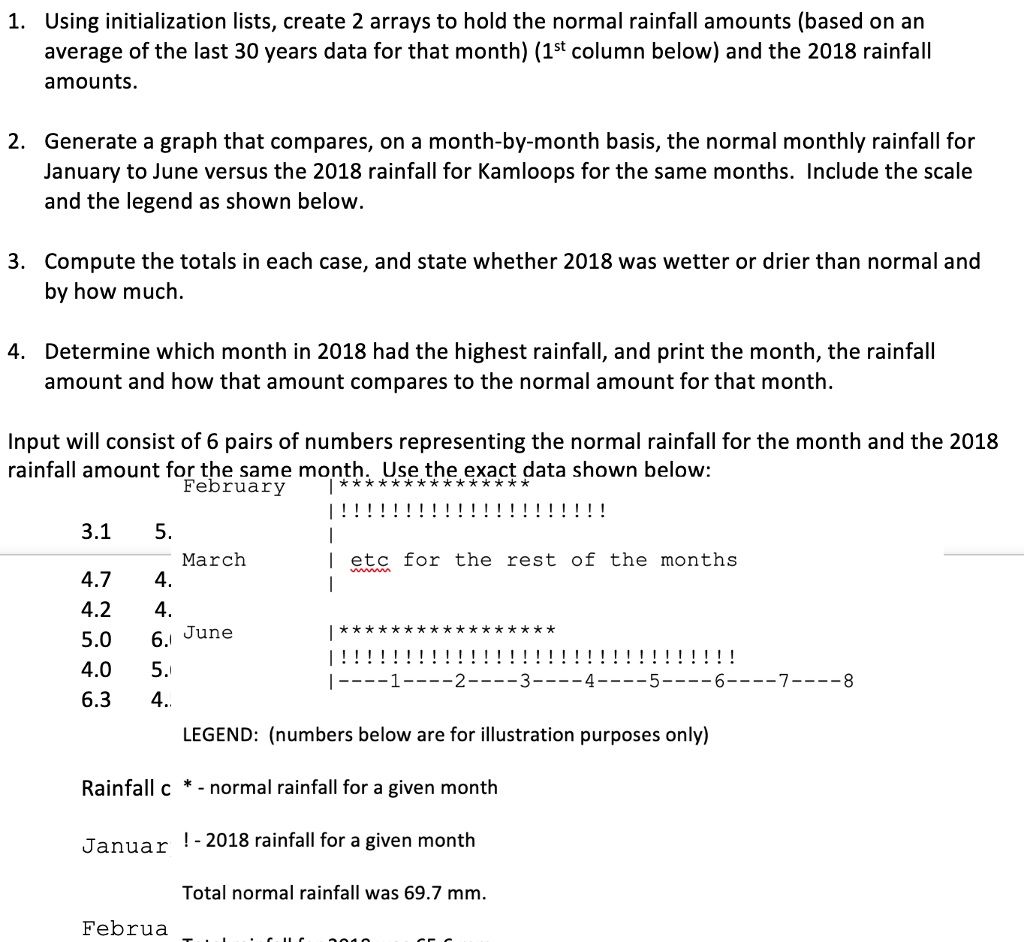
1. Using initialization lists, create 2 arrays to hold the normal rainfall amounts (based on an average of the last 30 years data for that month) (1st column below) and the 2018 rainfall amounts.
2. Generate a graph that compares, on a month-by-month basis, the normal monthly rainfall for January to June versus the 2018 rainfall for Kamloops for the same months. Include the scale and the legend as shown below.
3. Compute the totals in each case, and state whether 2018 was wetter or drier than normal and by how much.
4. Determine which month in 2018 had the highest rainfall, and print the month, the rainfall amount and how that amount compares to the normal amount for that month. Input will consist of 6 pairs of numbers representing the normal rainfall for the month and the 2018 rainfall amount for the same month.
Use the exact data shown below: 3.1 5.4 January data (normal first, then 2018 data)
4.7 4.4 February data 4.2 4.1 5.0 6.0 4.0 5.6 6.3 4.5
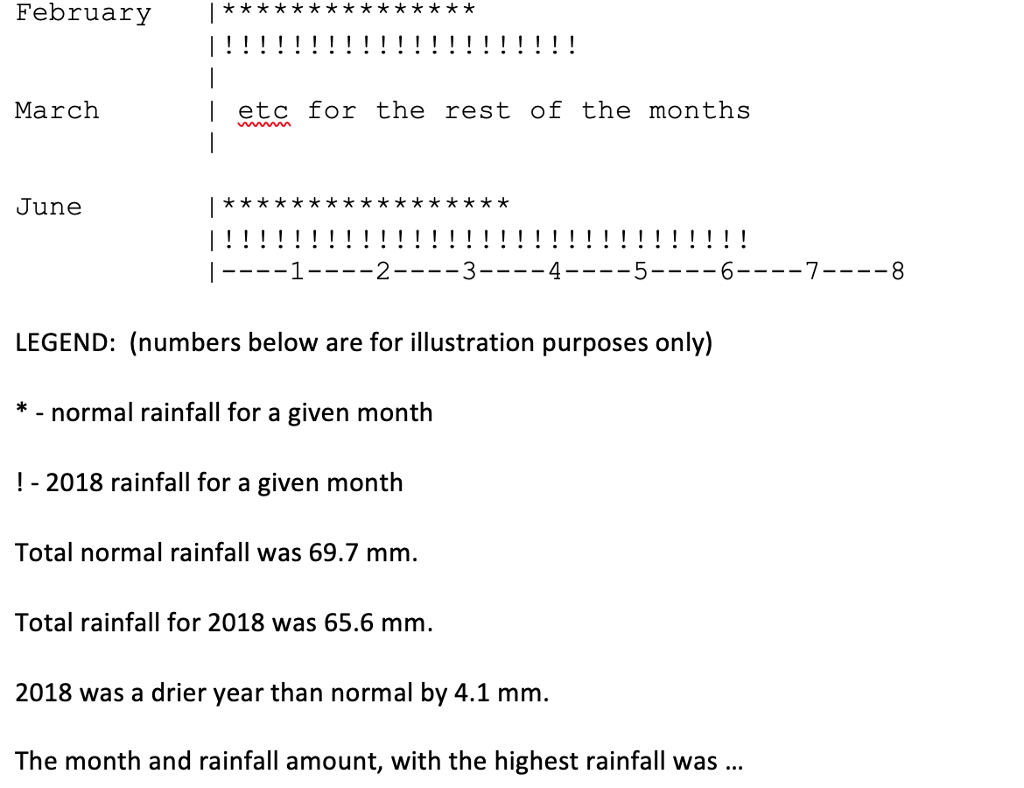
Rainfall comparison for January to June 2018
January |*********** |!!!!!!!!!!!!!!!!!!!!!!!!!
| February |***************
|!!!!!!!!!!!!!!!!!!!!! | March |
etc for the rest of the months | June |***************** |!!!!!!!!!!!!!!!!!!!!!!!!!!!!!!! |----1----2----3----4----5----6----7----8 LEGEND: (numbers below are for illustration purposes only) * - normal rainfall for a given month ! -
2018 rainfall for a given month Total normal rainfall was 69.7 mm.
Total rainfall for 2018 was 65.6 mm. 2018 was a drier year than normal by 4.1 mm.
The month and rainfall amount, with the highest rainfall was
Mention : i did upload the assignment picture . Plz make sure , the solution is to be in "C" program.
Plz use simple method to solving the question. Thanks in advance.
Using initialization lists, create 2 arrays to hold the normal rainfall amounts (based on an average of the last 30 years data for that month) (1St column below) and the 2018 rainfall amounts. 1. 2. Generate a graph that compares, on a month-by-month basis, the normal monthly rainfall for January to June versus the 2018 rainfall for Kamloops for the same months. Include the scale and the legend as shown below Compute the totals in each case, and state whether 2018 was wetter or drier than normal and by how much 3. Determine which month in 2018 had the highest rainfall, and print the month, the rainfall amount and how that amount compares to the normal amount for that month. 4. Input will consist of 6 pairs of numbers representing the normal rainfall for the month and the 2018 rainfall amount for the same month. Use the exact data shown below: February 3.1 5. March | etc for the rest of the months 4.7 4. 4.2 4. 5.0 6. June 4.0 5. 6.34 1 2 3 4 7 LEGEND: (numbers below are for illustration purposes only) Rainfall c * - normal rainfall for a given month Januar !-2018 rainfall for a given month Total normal rainfall was 69.7 mm Februa March I etc for the rest of the June LEGEND: (numbers below are for illustration purposes only) normal rainfall for a given month !- 2018 rainfall for a given month Total normal rainfall was 69.7 mm Total rainfall for 2018 was 65.6 mm. 2018 was a drier year than normal by 4.1 mm. The month and rainfall amount, with the highest rainfall was
Step by Step Solution
There are 3 Steps involved in it

Get step-by-step solutions from verified subject matter experts