

Question: Important : Those inputs 3.1 and so on ---which used for month and 2018 rain data are as example . User will input every Input
Important : Those inputs 3.1 and so on ---which used for month and 2018 rain data are as ""example"" . User will input every Input (make array input function) . And plz make sure the graph will show like as picture (don't move by moving) . *** Also after taking all inputs , all inputs shows in the output Display in 2 column as like in pic . and if possible don't use any graph method. . (((( DON't post in comment previous solve ) . Thanks in advance .
3 Things IMP ::
1. user will give all input
2. Graph should be work perfect
3. Inputs also display in Output display in 2 column
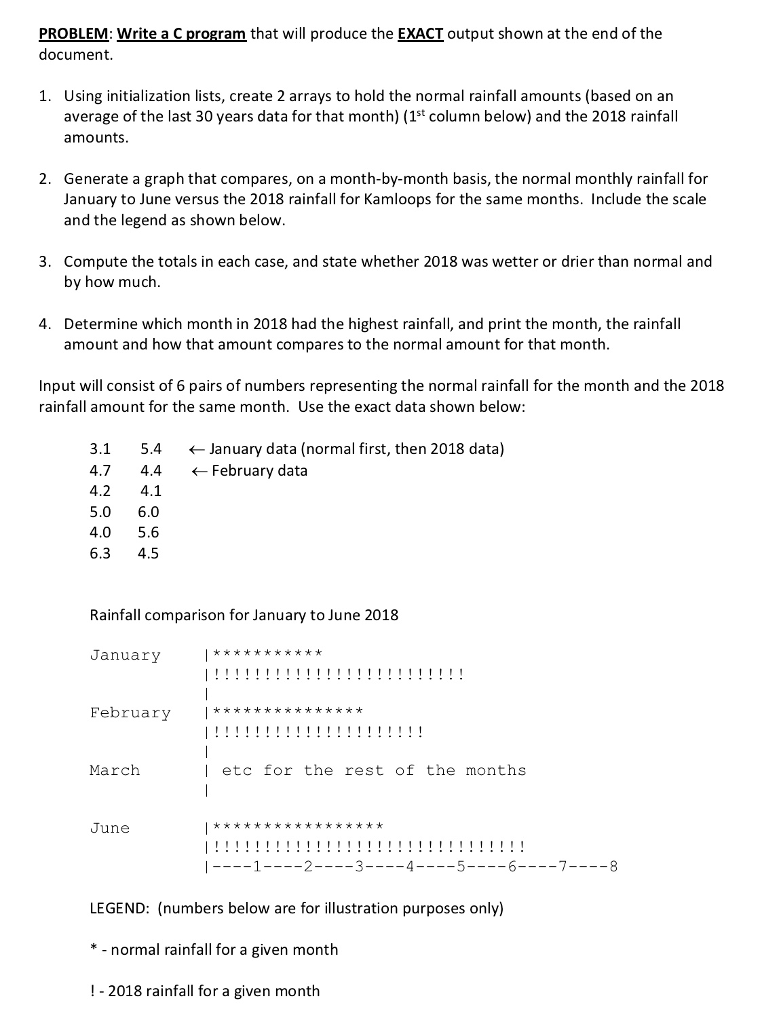
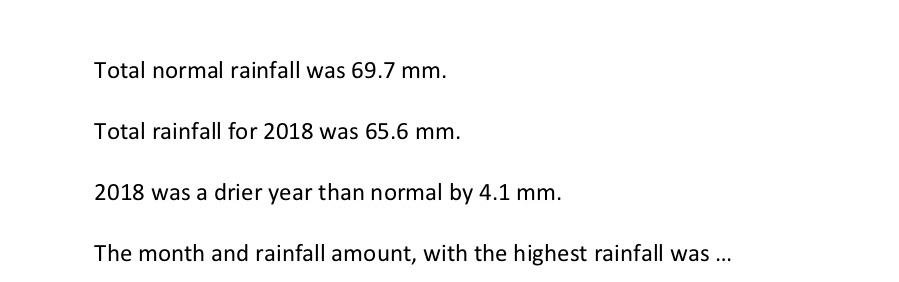
PROBLEM: Write a C program that will produce the EXACT output shown at the end of the document. 1. Using initialization lists, create 2 arrays to hold the normal rainfall amounts (based on an average of the last 30 years data for that month) (1st column below) and the 2018 rainfall amounts 2. Generate a graph that compares, on a month-by-month basis, the normal monthly rainfall for January to June versus the 2018 rainfall for Kamloops for the same months. Include the scale and the legend as shown below Compute the totals in each case, and state whether 2018 was wetter or drier than normal and by how much 3. 4. Determine which month in 2018 had the highest rainfall, and print the month, the rainfall amount and how that amount compares to the normal amount for that month Input will consist of 6 pairs of numbers representing the normal rainfall for the month and the 2018 rainfall amount for the same month. Use the exact data shown below: 3.1 5.4
Step by Step Solution
There are 3 Steps involved in it

Get step-by-step solutions from verified subject matter experts