

Question: 1. Using MATLAB, plot a sine function, sin(wt), where w is the frequency of oscillation. Do the followings. (1) Create a time vector, t, from
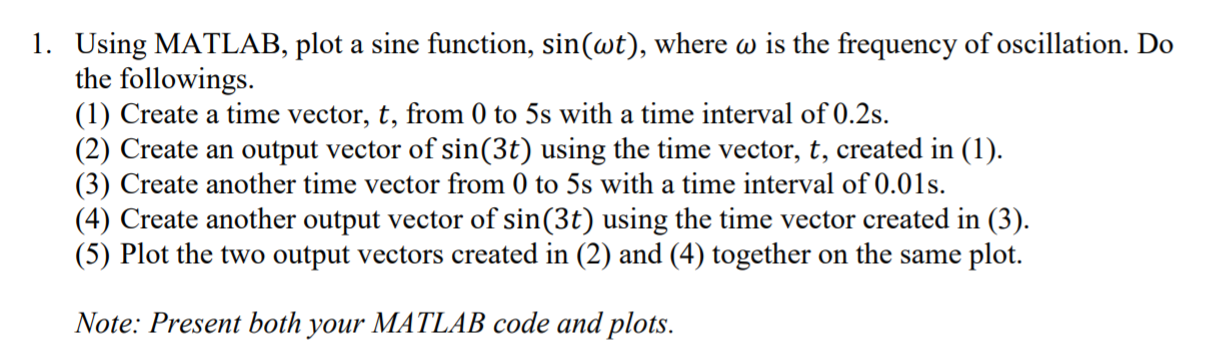
1. Using MATLAB, plot a sine function, sin(wt), where w is the frequency of oscillation. Do the followings. (1) Create a time vector, t, from 0 to 5s with a time interval of 0.2s. (2) Create an output vector of sin(3t) using the time vector, t, created in (1). (3) Create another time vector from 0 to 5s with a time interval of 0.01s. (4) Create another output vector of sin(3t) using the time vector created in (3). (5) Plot the two output vectors created in (2) and (4) together on the same plot. Note: Present both your MATLAB code and plots
Step by Step Solution
There are 3 Steps involved in it
1 Expert Approved Answer
Step: 1 Unlock

Question Has Been Solved by an Expert!
Get step-by-step solutions from verified subject matter experts
Step: 2 Unlock
Step: 3 Unlock