

Question: 1. Using the 2018 GSS data to examine the relationship between sex (sex) and personal income (conrinc) conrinc is a numerical variable, measured in

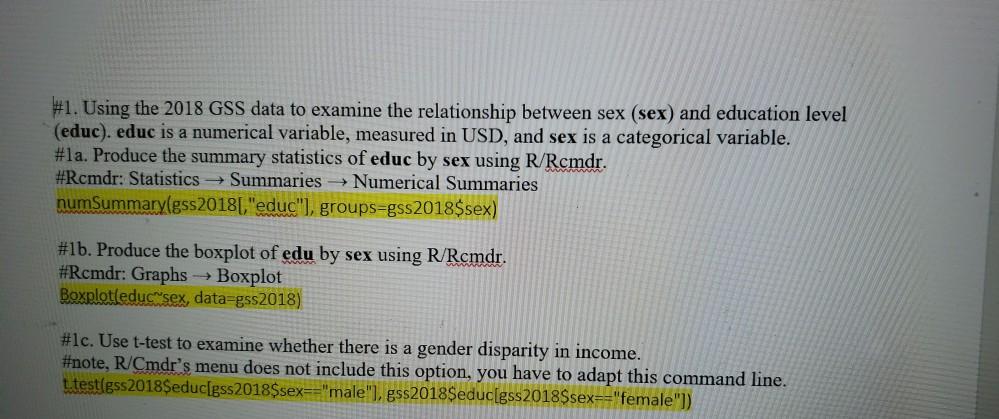
1. Using the 2018 GSS data to examine the relationship between sex (sex) and personal income (conrinc) conrinc is a numerical variable, measured in USD, and sex is a categorical variable 1a Reproduce the summary statistics of conrinc by sex using R/Rcmdr. 1b. Reproduce the boxplot Iconrinc by sex using R/Rcmdr 1c Use t-test to examine whether there is a gender disparity in income 2 1sing the 2018. GSS to examino rolf identifind #1. Using the 2018 GSS data to examine the relationship between sex (sex) and education level (educ). educ is a numerical variable, measured in USD, and sex is a categorical variable. #la. Produce the summary statistics of educ by sex using R/Rcmdr. #Rcmdr: Statistics Summaries Numerical Summaries numSummary(gss2018[,"educ"], groups-gss2018$sex) #1b. Produce the boxplot of edu by sex using R/Rcmdr. #Rcmdr: Graphs Boxplot Boxplot(educ sex, data=gss2018) #1c. Use t-test to examine whether there is a gender disparity in income. #note, R/Cmdr's menu does not include this option, you have to adapt this command line. t.test(gss2018$educ[gss2018$sex=="male"], gss2018$educ[gss2018$sex=="female"])
Step by Step Solution
3.47 Rating (157 Votes )
There are 3 Steps involved in it
1a Reproduce the summary statistics of conrinc by sex using RRcmdr RRcmdr Statistics Summaries Numer... View full answer

Get step-by-step solutions from verified subject matter experts