

Question: 1. Using the data in Table 1, calculate the following Averages: 1. Arithmetic Mean (to 1 decimal place) ii. Mode ii. Median Table 1: 3
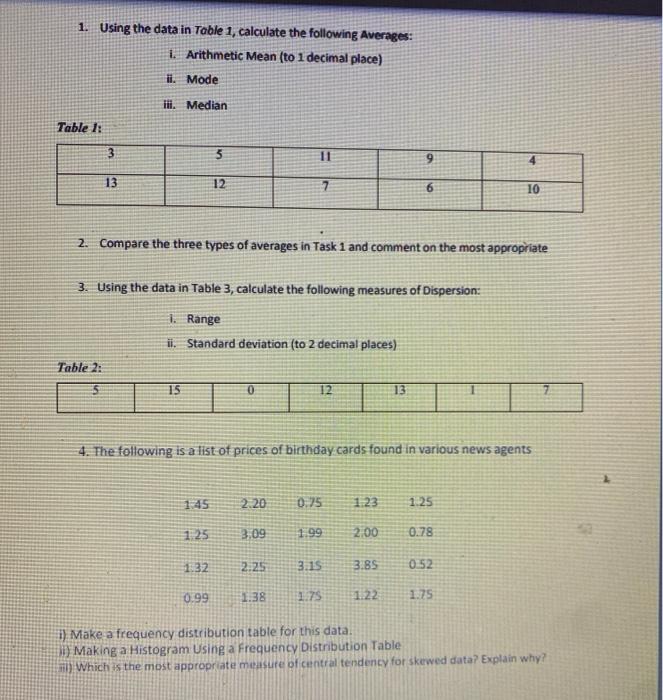
1. Using the data in Table 1, calculate the following Averages: 1. Arithmetic Mean (to 1 decimal place) ii. Mode ii. Median Table 1: 3 5 11 9 4 13 12 6 10 2. Compare the three types of averages in Task 1 and comment on the most appropriate 3. Using the data in Table 3, calculate the following measures of Dispersion: 1. Range i. Standard deviation (to 2 decimal places) Table 2: 15 0 12 13 7 4. The following is a list of prices of birthday cards found in various news agents 145 2.20 0.75 1.23 1.25 1.25 3.09 1.99 2.00 0.78 132 2.25 3.15 3.BS 0.52 0.99 1.38 1.75 1.22 1.75 i) Make a frequency distribution table for this data. i) Making a Histogram Using a Frequency Distribution Table 1) Which is the most appropriate measure of central tendency for skewed data? Explain why
Step by Step Solution
There are 3 Steps involved in it

Get step-by-step solutions from verified subject matter experts