Question: Summarizing Data Use the rounding rules from the textbook. Round one place past the original data om the following operations on the weight in pounds
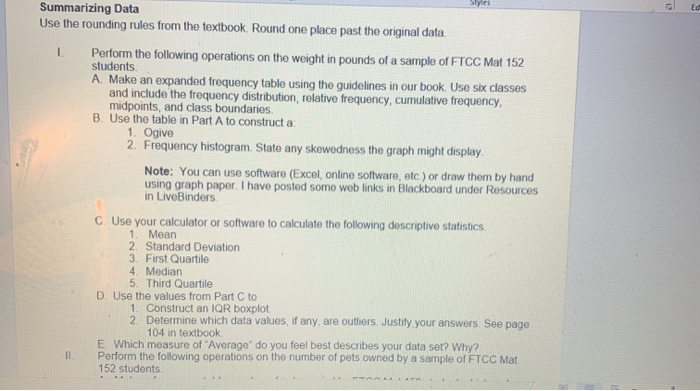
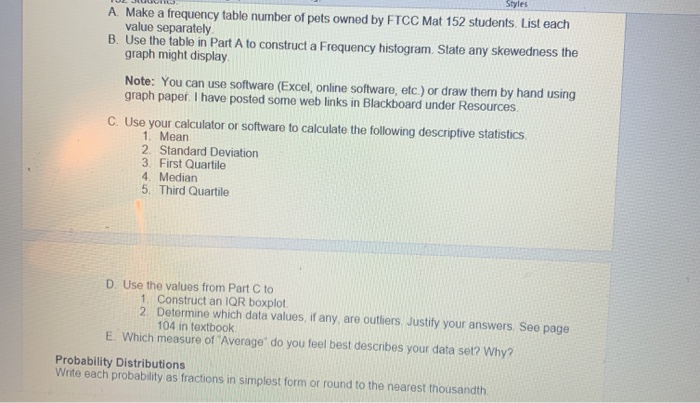
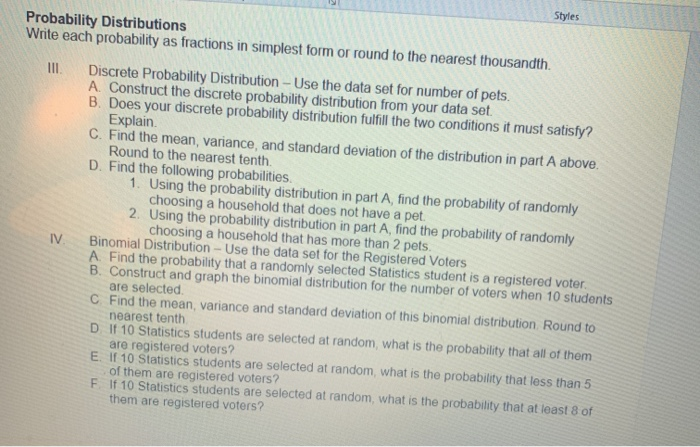
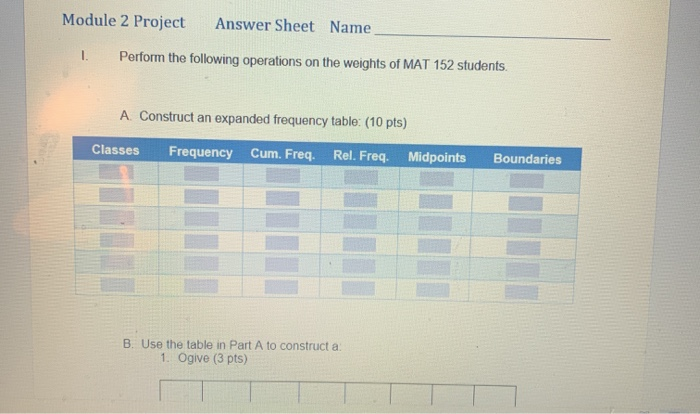
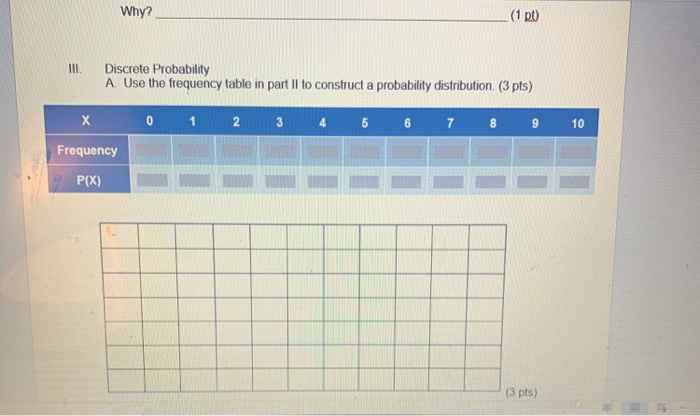
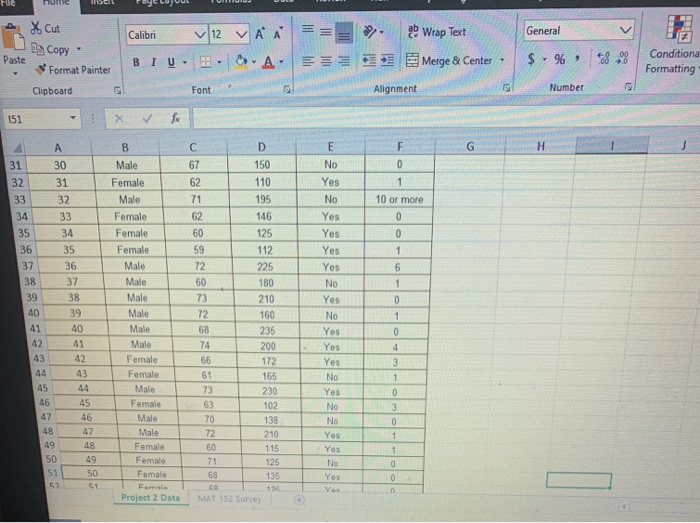
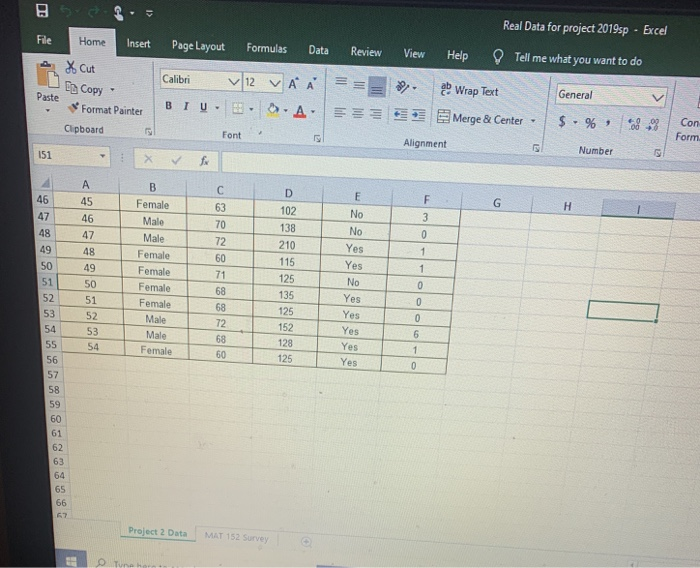
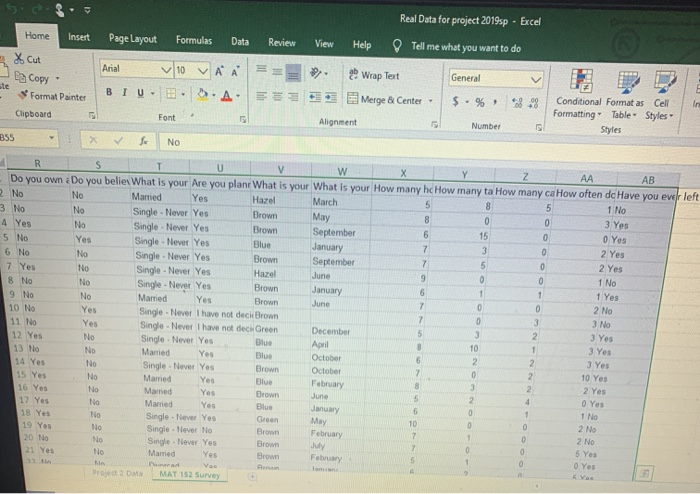
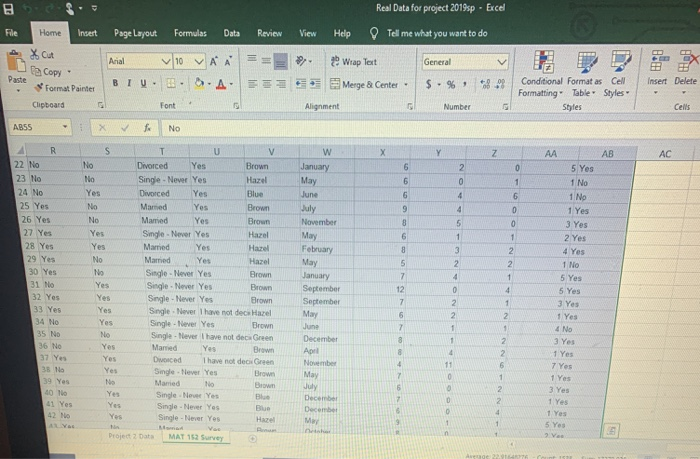
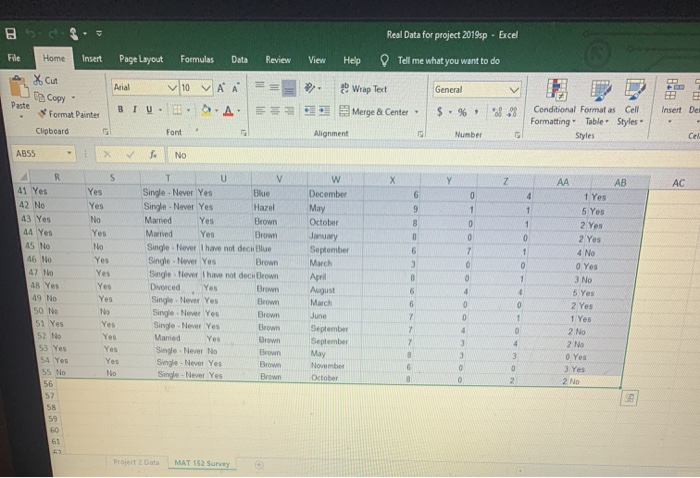
Summarizing Data Use the rounding rules from the textbook. Round one place past the original data om the following operations on the weight in pounds of a sample of FTCC Mat 152 students A Make an expanded frequency table using the guidelines in our book. Use six classes and include the frequency distribution, relative frequency, cumulative frequency midpoints, and class boundaries. B. Use the table in Part A to construct a: 1. Ogive 2. Frequency histogram. State any skewedness the graph might display Note: You can use software (Excel, online software, etc.) or draw them by hand using graph paper. I have posted somo wob links in Blackboard under Resources in LiveBinders C. Use your calculator or software to calculate the following descriptive statistics 1. Mean 2. Standard Deviation 3. First Quartile 4. Median 5. Third Quartile D. Use the values from Part C to 1. Construct an IQR boxplot 2. Determine which data values, if any, are outliers. Justify your answers See page 104 in textbook E. Which measure of "Averago" do you feel best describes your data set? Why? Perform the following operations on the number of pets owned by a sample of FTCC Mat 152 students Il Styles A Make a frequency table number of pets owned by FTCC Mat 152 students List each value separately B. Use the table in Part A to construct a Frequency histogram. State any skewedness the graph might display Note: You can use software (Excel, online software, etc.) or draw them by hand using graph paper. I have posted some web links in Blackboard under Resources C. Use your calculator or software to calculate the following descriptive statistics 1. Mean 2. Standard Deviation 3. First Quartile 4. Median 5. Third Quartile D. Use the values from Part C to 1. Construct an IQR boxplot. 2. Determine which data values, if any, are outliers. Justify your answers. See page 104 in textbook E Which measure of 'Average' do you feel best describes your data set? Why? Probability Distributions Write each probability as fractions in simplest form or round to the nearest thousandth Styles Probability Distributions Write each probability as fractions in simplest form or round to the nearest thousandth IV. Discrete Probability Distribution - Use the data set for number of pets. A Construct the discrete probability distribution from your data set. B. Does your discrete probability distribution fulfill the two conditions it must satisfy? Explain. C. Find the mean, variance, and standard deviation of the distribution in part A above. Round to the nearest tenth. D. Find the following probabilities 1. Using the probability distribution in part A, find the probability of randomly choosing a household that does not have a pet. 2. Using the probability distribution in part A, find the probability of randomly choosing a household that has more than 2 pets. Binomial Distribution - Use the data set for the Registered Voters A Find the probability that a randomly selected Statistics student is a registered voter. B. Construct and graph the binomial distribution for the number of voters when 10 students are selected C. Find the mean, variance and standard deviation of this binomial distribution Round to nearest tenth D. If 10 Statistics students are selected at random, what is the probability that all of them are registered voters? E. If 10 Statistics students are selected at random, what is the probability that less than 5 of them are registered voters? F. If 10 Statistics students are selected at random, what is the probability that at least 8 of them are registered voters? Module 2 Project Answer Sheet Name 1. Perform the following operations on the weights of MAT 152 students. A Construct an expanded frequency table: (10 pts) Classes Frequency Cum. Freq. Rel. Freq. Midpoints Boundaries B. Use the table in Part A to construct a. 1. Ogive (3 pts) B. Use the table in Part A to construct a: 1. Ogive (3 pts) 2. Histogram (3 pts) Shape of Graph (1 pts) C. Use your calculator to find the following C. Use your calculator to find the following: 1. Mean = _ (2 pts) 2. Standard Deviation = _ (2 pts) 3. First Quartile = (2 pts) 4. Median = L _ (2 pts) ente 5. Third Quartile = _(2 pts) D. Use the values from Part C to 1. Construct a box-n-whisker plot (3 pts) 2. Outliers: Justification E. Best measure of center. Why? (101) (1 pt) (1 pt) II. Perform the following operations on the number of pets owned by MAT 152 students. A Construct a frequency table of the number of pets that are owned. (3 pts) No. of pets Frequency OWNO B. Construct a frequency histogram of the number of pets that are owned. (3 pts) (1 pts) Shape of Graph C. Use your calculator 1. Mean = (2 pts) 2. Standard Deviation = (2 pts) 3. First Quartile = (2 pts) _(2 pts) 4. Median = __ _ (2 pts) 5. Third Quartile = D. Use the values from Part C to 1. Construct a box-n-whisker plot (3 pts) 2. Outliers: (1 Rt) Justification (1 pt) E. Best measure of center (11) Why? (100 III. Discrete Probability A. Use the frequency table in part II to construct a probability distribution (3 pts) X 0 1 2 3 4 5 6 7 8 9 10 Frequency 9 PIX) (3 pts) Styles (3 pts) (2 pts) C. Mean = (2 pts), variance = (2 pts), standard deviation = _ (2 pts) D. Use the probability distribution to find the following probabilities. (2 pts) (2 pts) Binomial probability IV (2 pts) B. Construct binomial probability distribution (4 pts) (3 pts) (2 pts) C. Mean = (2 pts), variance = (2 pts), standard deviation = (2 pts) D. Use the probability distribution to find the following probabilities. (2 pts) (2 pts) IV. Binomial probability (2 pts) B. Construct binomial probability distribution (4 pts) X P(X) - - w o Draw a histogram (3 pts) Draw a histogram (3 pts) C. Mean = (2 pts), Variance = (2 pts) Standard deviation = (2 pts) (3 pts) (3 pts) (3 pts) X Cut Copy * Format Painter Calibri BIU V12 V . 2 Wrap Text Merge & Center - General $ . % Paste 22 48% Conditions Formatting Font Alignment Number 151 - x fa 30 Male Female Male 150 110 195 10 or more Female lo Female Female Male Male Male Male Male Male Female No Yes Yes Female 172 165 Male Female Male 47 Male 48 Fomale F 49 50 135 Project 2 Data MATS Surve Real Data for project 2019sp - Excel File Page Layout Formulas Data Review View Help Tell me what you want to do 2 Home Insert X Cut Eg Copy Format Painter Clipboard . Calibri BIU V 12 VAA == .S.A. Ez Wrap Text Merge & Center - General $ - %, Paste - 8. Con Form Font Alignment Number 151 102 138 23- 210 SSSSSan 115 Female Male Male Female Female Female Female Male Male Female ---- 125 125 125 Yes Yes 0 Yes 152 129 125 Yes 60 Project 2 Data MAT 152 Survey Real Data for project 2019sp - Excel Arial Home Insert Page Layout Formulas Data Review View Help Tell me what you want to do of Cut V10 VAN Wrap Text General Copy IU . DA FEE Merge & Center $ . % Conditional Format as Cell 898 Format Painter Formatting Table Styles 5 Font Alignment Number Styles 355 * v No I R S T V W AA AB Do you own Do you beliex What is your Are you plan What is your What is your How many hc How many ta How many ca How often de Have you ever left No Married Yes Hazel March 1 No 3 No Single - Never Yes Brown May 3 Yes 4 Yes No Single - Never Yes Brown September 0 Yes 5 No Yes Single - Never Yes Blue January 2 Yes 6 No Single - Never Yes Brown September 2 Yes 7 Yes Single - Never Yes Hazel June 1 No 8 No No Single - Never Yes Brown January 1 Yes 9 No Married Yes Brown 2 No 10 No Yes Single - Never I have not decis Brown 3 No 111 No Yes Single - Never I have not deca Green December 3 Yes 12 Yes No Single - Never Yes Blue April 3 Yes 13 to Married Yes Blue October 3 Yes 14 Yes Single Never Yes Brown October 10 Yes 15 Yes Med Yes February 2 Yes 16 Yes No Married Yes Brown June 0 Yes 17 Yes No Married You Blue Jan 1 No 18 Yes Single-lever Yes Green 2 No 19 Yes No Single - Never No Brown February 20 No No Singlever Yes Brown | 22 Yes No Mamed Yes Brown February 23 Ben D O MAT 152 Survey June 2 No Yes Real Data for project 2019sp - Excel Tell me what you want to do File Insert Page Layout Formulas Data Review View Help Home X Cut Arial 10 A . General Copy ? Wrap Text Merge & Center. BIU. . .A. $. Op Insert Delete Format Painter Clipboard Conditional Format as Cell Formatting Table Styles Font Alignment Sbles Cells ABSS fr No V AB AC No Yes 5 Yes 1 No 1 No 1 Yes 3 Yes 2 Yes No W January May June July November May February May January September Yes Yes 4 Yes 1 No AR 22 No 23 No 24 No 25 Yes 26 Yes 27 Yes 28 Yes 29 Yes 30 Yes 31 No 32 Yes 33 Yes 34 No 35 No 36 No 37 Yes 38 No 39 Yes 40 To 41 Yes 42 No 5 Yes Divorced Yes Brown Single - Never Yes Hazel Divorced Yes Blue Mamed Yes Brown Married Yes Brown Single - Never Yes Hazel Married Yes Hazel Married Yes Hazel Single - Never Yes Brown Single - Never Yes Brown Single - Never Yes Brown Single Never I have not des Hazel Single - Never Yes Brown Single Never I have not deca Green Married Yes Divorced I have not de Green Smde Never Yes Brown Maried No. Brown Single New Yes Single - Never Yes Single - Never Yes Yes September May June December 1 Yes No 3 Yes 1 Yes 7 Yes 1 Yes 3 Yes 1 Yes 1 Yes Droject 2 Data MAT 152 Survey Real Data for project 2019sp - Excel Review View Help Tell me what you want to do General File Home Insert Page Layout Formulas Data A Xcut Arial V10 VAN Paste De Copy Format Painter BIU. . .A Ciboard Font ABSS X f No Wrap Text Merge & Center Insert De Conditional Formatas Cell Formatting Table Styles Styles Alignment Number Yes Yes No Yes No R 41 Yes 42 No 43 Yes 44 Yes 45 No 46 No 47 No 48 Yes 49 No SON 51 Yes 52 No 53 Yes SA Yes 55 No Yes Yes Single - Never Yes kie Single - Never Yes Hazel Married Yes Brown Married Yes Brown Single Never I have not deciBlue Single. Never Yes Brown Single Never I have not deck Brown Divorced Yes Brown Single Never Yes Single Never Yes B Singo Never Yes Yes Setto Single Never Yes Prown Segelever Yes December May October January September March April August March June September September 0 Yes 3 No 2 Yes 1 Yes 2 No 2 N November October Project 2 Onta MAT 152 Survey Summarizing Data Use the rounding rules from the textbook. Round one place past the original data om the following operations on the weight in pounds of a sample of FTCC Mat 152 students A Make an expanded frequency table using the guidelines in our book. Use six classes and include the frequency distribution, relative frequency, cumulative frequency midpoints, and class boundaries. B. Use the table in Part A to construct a: 1. Ogive 2. Frequency histogram. State any skewedness the graph might display Note: You can use software (Excel, online software, etc.) or draw them by hand using graph paper. I have posted somo wob links in Blackboard under Resources in LiveBinders C. Use your calculator or software to calculate the following descriptive statistics 1. Mean 2. Standard Deviation 3. First Quartile 4. Median 5. Third Quartile D. Use the values from Part C to 1. Construct an IQR boxplot 2. Determine which data values, if any, are outliers. Justify your answers See page 104 in textbook E. Which measure of "Averago" do you feel best describes your data set? Why? Perform the following operations on the number of pets owned by a sample of FTCC Mat 152 students Il Styles A Make a frequency table number of pets owned by FTCC Mat 152 students List each value separately B. Use the table in Part A to construct a Frequency histogram. State any skewedness the graph might display Note: You can use software (Excel, online software, etc.) or draw them by hand using graph paper. I have posted some web links in Blackboard under Resources C. Use your calculator or software to calculate the following descriptive statistics 1. Mean 2. Standard Deviation 3. First Quartile 4. Median 5. Third Quartile D. Use the values from Part C to 1. Construct an IQR boxplot. 2. Determine which data values, if any, are outliers. Justify your answers. See page 104 in textbook E Which measure of 'Average' do you feel best describes your data set? Why? Probability Distributions Write each probability as fractions in simplest form or round to the nearest thousandth Styles Probability Distributions Write each probability as fractions in simplest form or round to the nearest thousandth IV. Discrete Probability Distribution - Use the data set for number of pets. A Construct the discrete probability distribution from your data set. B. Does your discrete probability distribution fulfill the two conditions it must satisfy? Explain. C. Find the mean, variance, and standard deviation of the distribution in part A above. Round to the nearest tenth. D. Find the following probabilities 1. Using the probability distribution in part A, find the probability of randomly choosing a household that does not have a pet. 2. Using the probability distribution in part A, find the probability of randomly choosing a household that has more than 2 pets. Binomial Distribution - Use the data set for the Registered Voters A Find the probability that a randomly selected Statistics student is a registered voter. B. Construct and graph the binomial distribution for the number of voters when 10 students are selected C. Find the mean, variance and standard deviation of this binomial distribution Round to nearest tenth D. If 10 Statistics students are selected at random, what is the probability that all of them are registered voters? E. If 10 Statistics students are selected at random, what is the probability that less than 5 of them are registered voters? F. If 10 Statistics students are selected at random, what is the probability that at least 8 of them are registered voters? Module 2 Project Answer Sheet Name 1. Perform the following operations on the weights of MAT 152 students. A Construct an expanded frequency table: (10 pts) Classes Frequency Cum. Freq. Rel. Freq. Midpoints Boundaries B. Use the table in Part A to construct a. 1. Ogive (3 pts) B. Use the table in Part A to construct a: 1. Ogive (3 pts) 2. Histogram (3 pts) Shape of Graph (1 pts) C. Use your calculator to find the following C. Use your calculator to find the following: 1. Mean = _ (2 pts) 2. Standard Deviation = _ (2 pts) 3. First Quartile = (2 pts) 4. Median = L _ (2 pts) ente 5. Third Quartile = _(2 pts) D. Use the values from Part C to 1. Construct a box-n-whisker plot (3 pts) 2. Outliers: Justification E. Best measure of center. Why? (101) (1 pt) (1 pt) II. Perform the following operations on the number of pets owned by MAT 152 students. A Construct a frequency table of the number of pets that are owned. (3 pts) No. of pets Frequency OWNO B. Construct a frequency histogram of the number of pets that are owned. (3 pts) (1 pts) Shape of Graph C. Use your calculator 1. Mean = (2 pts) 2. Standard Deviation = (2 pts) 3. First Quartile = (2 pts) _(2 pts) 4. Median = __ _ (2 pts) 5. Third Quartile = D. Use the values from Part C to 1. Construct a box-n-whisker plot (3 pts) 2. Outliers: (1 Rt) Justification (1 pt) E. Best measure of center (11) Why? (100 III. Discrete Probability A. Use the frequency table in part II to construct a probability distribution (3 pts) X 0 1 2 3 4 5 6 7 8 9 10 Frequency 9 PIX) (3 pts) Styles (3 pts) (2 pts) C. Mean = (2 pts), variance = (2 pts), standard deviation = _ (2 pts) D. Use the probability distribution to find the following probabilities. (2 pts) (2 pts) Binomial probability IV (2 pts) B. Construct binomial probability distribution (4 pts) (3 pts) (2 pts) C. Mean = (2 pts), variance = (2 pts), standard deviation = (2 pts) D. Use the probability distribution to find the following probabilities. (2 pts) (2 pts) IV. Binomial probability (2 pts) B. Construct binomial probability distribution (4 pts) X P(X) - - w o Draw a histogram (3 pts) Draw a histogram (3 pts) C. Mean = (2 pts), Variance = (2 pts) Standard deviation = (2 pts) (3 pts) (3 pts) (3 pts) X Cut Copy * Format Painter Calibri BIU V12 V . 2 Wrap Text Merge & Center - General $ . % Paste 22 48% Conditions Formatting Font Alignment Number 151 - x fa 30 Male Female Male 150 110 195 10 or more Female lo Female Female Male Male Male Male Male Male Female No Yes Yes Female 172 165 Male Female Male 47 Male 48 Fomale F 49 50 135 Project 2 Data MATS Surve Real Data for project 2019sp - Excel File Page Layout Formulas Data Review View Help Tell me what you want to do 2 Home Insert X Cut Eg Copy Format Painter Clipboard . Calibri BIU V 12 VAA == .S.A. Ez Wrap Text Merge & Center - General $ - %, Paste - 8. Con Form Font Alignment Number 151 102 138 23- 210 SSSSSan 115 Female Male Male Female Female Female Female Male Male Female ---- 125 125 125 Yes Yes 0 Yes 152 129 125 Yes 60 Project 2 Data MAT 152 Survey Real Data for project 2019sp - Excel Arial Home Insert Page Layout Formulas Data Review View Help Tell me what you want to do of Cut V10 VAN Wrap Text General Copy IU . DA FEE Merge & Center $ . % Conditional Format as Cell 898 Format Painter Formatting Table Styles 5 Font Alignment Number Styles 355 * v No I R S T V W AA AB Do you own Do you beliex What is your Are you plan What is your What is your How many hc How many ta How many ca How often de Have you ever left No Married Yes Hazel March 1 No 3 No Single - Never Yes Brown May 3 Yes 4 Yes No Single - Never Yes Brown September 0 Yes 5 No Yes Single - Never Yes Blue January 2 Yes 6 No Single - Never Yes Brown September 2 Yes 7 Yes Single - Never Yes Hazel June 1 No 8 No No Single - Never Yes Brown January 1 Yes 9 No Married Yes Brown 2 No 10 No Yes Single - Never I have not decis Brown 3 No 111 No Yes Single - Never I have not deca Green December 3 Yes 12 Yes No Single - Never Yes Blue April 3 Yes 13 to Married Yes Blue October 3 Yes 14 Yes Single Never Yes Brown October 10 Yes 15 Yes Med Yes February 2 Yes 16 Yes No Married Yes Brown June 0 Yes 17 Yes No Married You Blue Jan 1 No 18 Yes Single-lever Yes Green 2 No 19 Yes No Single - Never No Brown February 20 No No Singlever Yes Brown | 22 Yes No Mamed Yes Brown February 23 Ben D O MAT 152 Survey June 2 No Yes Real Data for project 2019sp - Excel Tell me what you want to do File Insert Page Layout Formulas Data Review View Help Home X Cut Arial 10 A . General Copy ? Wrap Text Merge & Center. BIU. . .A. $. Op Insert Delete Format Painter Clipboard Conditional Format as Cell Formatting Table Styles Font Alignment Sbles Cells ABSS fr No V AB AC No Yes 5 Yes 1 No 1 No 1 Yes 3 Yes 2 Yes No W January May June July November May February May January September Yes Yes 4 Yes 1 No AR 22 No 23 No 24 No 25 Yes 26 Yes 27 Yes 28 Yes 29 Yes 30 Yes 31 No 32 Yes 33 Yes 34 No 35 No 36 No 37 Yes 38 No 39 Yes 40 To 41 Yes 42 No 5 Yes Divorced Yes Brown Single - Never Yes Hazel Divorced Yes Blue Mamed Yes Brown Married Yes Brown Single - Never Yes Hazel Married Yes Hazel Married Yes Hazel Single - Never Yes Brown Single - Never Yes Brown Single - Never Yes Brown Single Never I have not des Hazel Single - Never Yes Brown Single Never I have not deca Green Married Yes Divorced I have not de Green Smde Never Yes Brown Maried No. Brown Single New Yes Single - Never Yes Single - Never Yes Yes September May June December 1 Yes No 3 Yes 1 Yes 7 Yes 1 Yes 3 Yes 1 Yes 1 Yes Droject 2 Data MAT 152 Survey Real Data for project 2019sp - Excel Review View Help Tell me what you want to do General File Home Insert Page Layout Formulas Data A Xcut Arial V10 VAN Paste De Copy Format Painter BIU. . .A Ciboard Font ABSS X f No Wrap Text Merge & Center Insert De Conditional Formatas Cell Formatting Table Styles Styles Alignment Number Yes Yes No Yes No R 41 Yes 42 No 43 Yes 44 Yes 45 No 46 No 47 No 48 Yes 49 No SON 51 Yes 52 No 53 Yes SA Yes 55 No Yes Yes Single - Never Yes kie Single - Never Yes Hazel Married Yes Brown Married Yes Brown Single Never I have not deciBlue Single. Never Yes Brown Single Never I have not deck Brown Divorced Yes Brown Single Never Yes Single Never Yes B Singo Never Yes Yes Setto Single Never Yes Prown Segelever Yes December May October January September March April August March June September September 0 Yes 3 No 2 Yes 1 Yes 2 No 2 N November October Project 2 Onta MAT 152 Survey