

Question: 1. Using the data in the following table, calculate: A. Average return and standard deviation for each stock (4 points) B. Covariance between the stocks
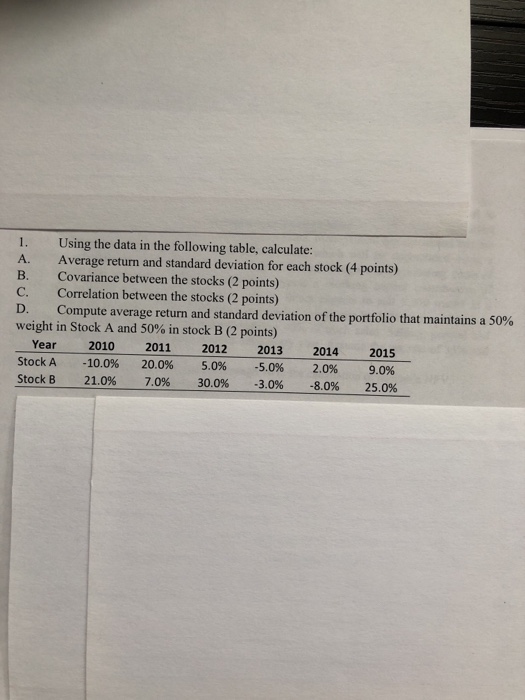
1. Using the data in the following table, calculate: A. Average return and standard deviation for each stock (4 points) B. Covariance between the stocks (2 points) C. Correlation between the stocks (2 points) D. Compute average return and standard deviation of the portfolio that maintains a 50% weight in Stock A and 50% in stock B (2 points) Year 2010 2011 2012 2013 2014 2015 Stock A -10.0% 20.0% 5.0% -5.0% 2.0% 9.0% Stock B 21.0% 7.0% 30.0% -3.0% -8.0% 25.0%
Step by Step Solution
There are 3 Steps involved in it
1 Expert Approved Answer
Step: 1 Unlock

Question Has Been Solved by an Expert!
Get step-by-step solutions from verified subject matter experts
Step: 2 Unlock
Step: 3 Unlock