

Question: 1. Using the finantial statements presented in problem 12, determine Eastnorth Manufacturing's degree of operating leverage in each of the years presented. Assume the cost
1. Using the finantial statements presented in problem 12, determine Eastnorth Manufacturing's degree of operating leverage in each of the years presented. Assume the cost of goods sold is variable and all other costs are fixed.
2. Using your estimate for the degree of operating leverage for Eastnorth in 2020, estimate the level of operating income if the following year's sales rise by 5%, or if the following year's sales fall by 12%.
I need help with these two questions. The picture is problem 12
thank you!
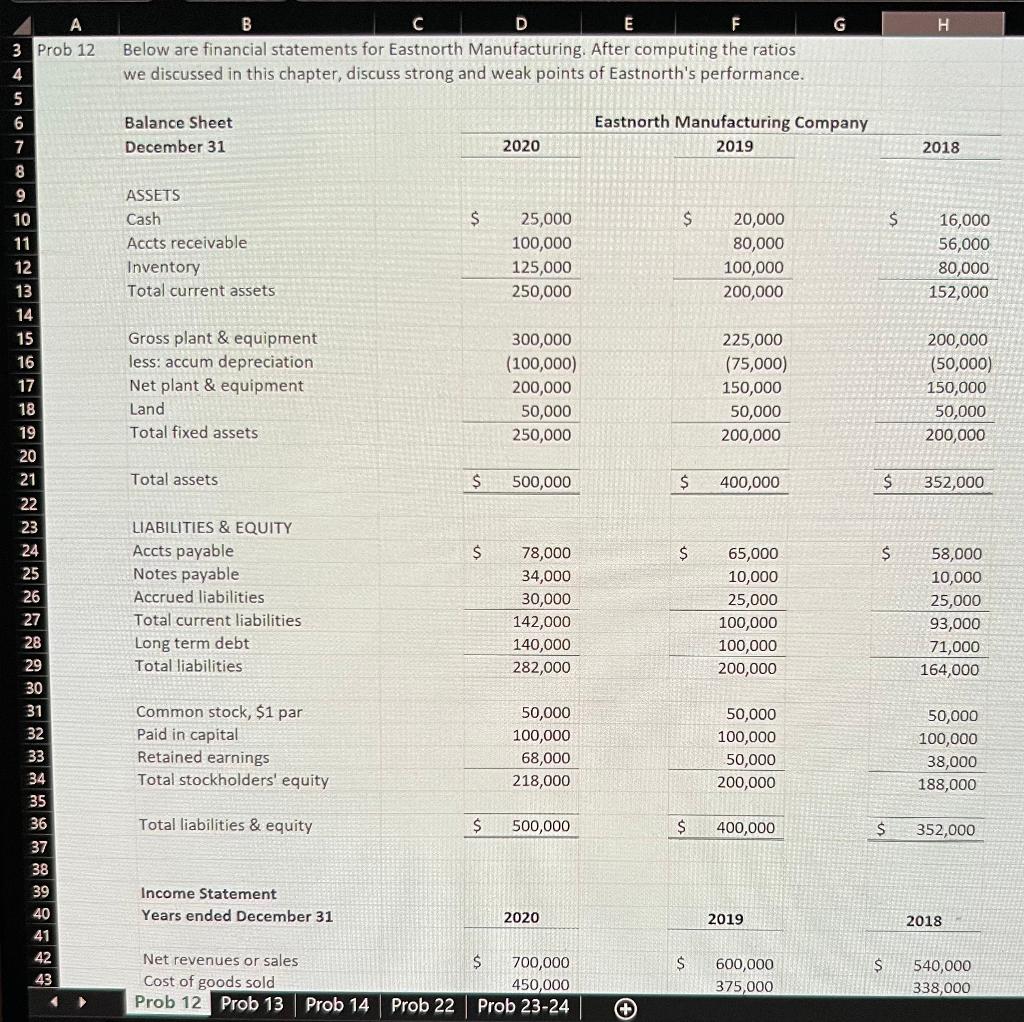
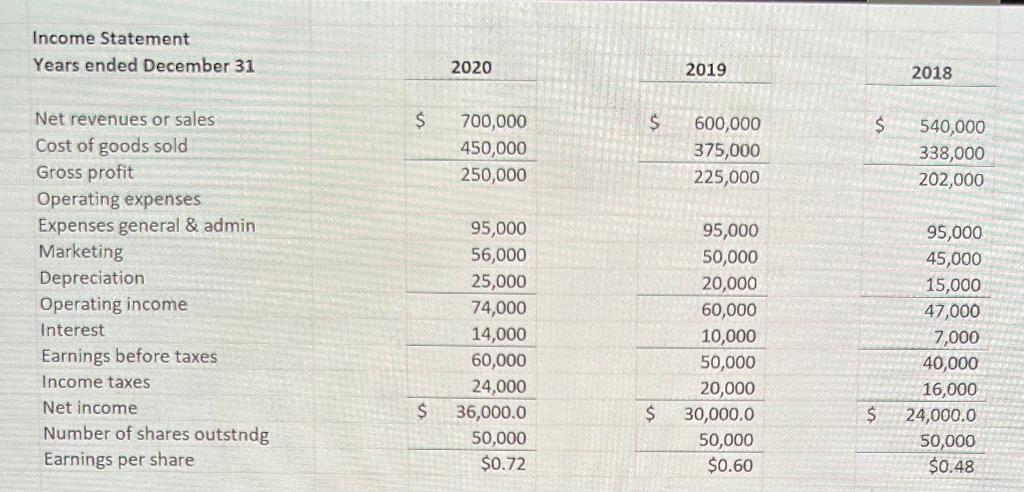
G H Prob 12 B D E F Below are financial statements for Eastnorth Manufacturing. After computing the ratios we discussed in this chapter, discuss strong and weak points of Eastnorth's performance. 5 6 7 Balance Sheet December 31 Eastnorth Manufacturing Company 2019 2020 2018 8 9 10 $ $ $ ASSETS Cash Accts receivable Inventory Total current assets 25,000 100,000 125,000 250,000 20,000 80,000 100,000 200,000 16,000 56,000 80,000 152,000 Gross plant & equipment less: accum depreciation Net plant & equipment Land Total fixed assets 300,000 (100,000) 200,000 50,000 250,000 225,000 (75,000) 150,000 50,000 200,000 200,000 (50,000) 150,000 50,000 200,000 Total assets $ 500,000 $ 400,000 $ 352,000 $ $ $ 11 12 13 14 15 16 17 18 19 20 21 22 23 24 25 26 27 28 29 30 31 32 33 34 35 36 37 38 39 40 41 LIABILITIES & EQUITY Accts payable Notes payable Accrued liabilities Total current liabilities Long term debt Total liabilities 78,000 34,000 30,000 142,000 140,000 282,000 65,000 10,000 25,000 100,000 100,000 200,000 58,000 10,000 25,000 93,000 71,000 164,000 Common stock, $1 par Paid in capital Retained earnings Total stockholders' equity 50,000 100,000 68,000 218,000 50,000 100,000 50,000 200,000 50,000 100,000 38,000 188,000 Total liabilities & equity $ 500,000 $ 400,000 352,000 Income Statement Years ended December 31 2020 2019 2018 42 $ $ 43 Net revenues or sales Cost of goods sold Prob 12 Prob 13 Prob 14 $ 700,000 450,000 Prob 23-24 600,000 375,000 540,000 338,000 Prob 22 + Income Statement Years ended December 31 2020 2019 2018 $ $ $ 700,000 450,000 250,000 600,000 375,000 225,000 540,000 338,000 202,000 Net revenues or sales Cost of goods sold Gross profit Operating expenses Expenses general & admin Marketing Depreciation Operating income Interest Earnings before taxes Income taxes Net income Number of shares outstndg Earnings per share 95,000 56,000 25,000 74,000 14,000 60,000 24,000 36,000.0 50,000 $0.72 95,000 50,000 20,000 60,000 10,000 50,000 20,000 30,000.0 50,000 $0.60 95,000 45,000 15,000 47,000 7,000 40,000 16,000 24,000.0 50,000 $0.48 $ $ $
Step by Step Solution
There are 3 Steps involved in it

Get step-by-step solutions from verified subject matter experts