

Question: 1. Using the graph below, show (by drawing the appropriate horizontal line and labeling it) the shut-down price and the break-even price. You MUST use

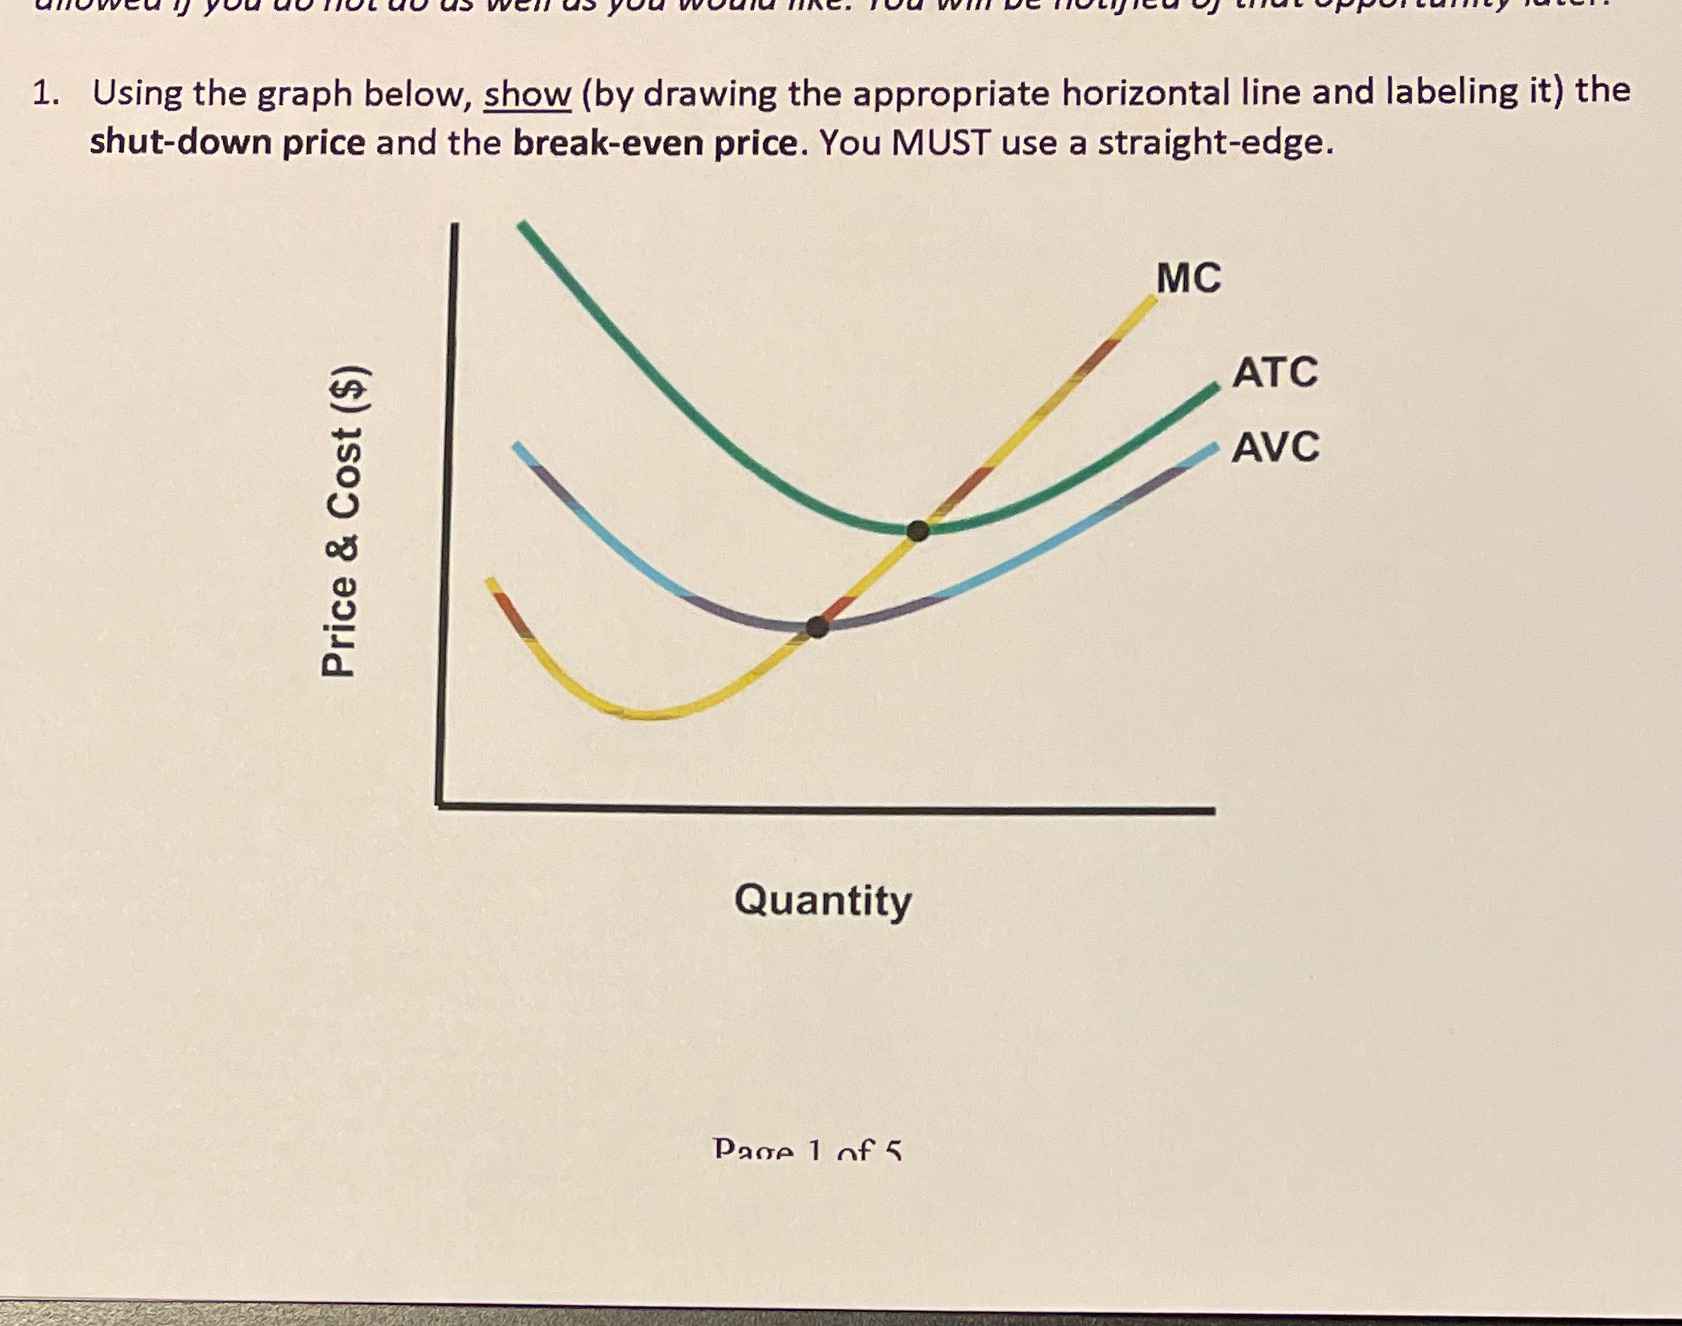
1. Using the graph below, show (by drawing the appropriate horizontal line and labeling it) the shut-down price and the break-even price. You MUST use a straight-edge. MC ATC AVC Price & Cost ($) Quantity Pane 1 of 5
Step by Step Solution
There are 3 Steps involved in it
1 Expert Approved Answer
Step: 1 Unlock

Question Has Been Solved by an Expert!
Get step-by-step solutions from verified subject matter experts
Step: 2 Unlock
Step: 3 Unlock