

Question: 1. Using the production function, compute the figures for marginal product using the definition given earlier in this module. Draw a graph of the marginal
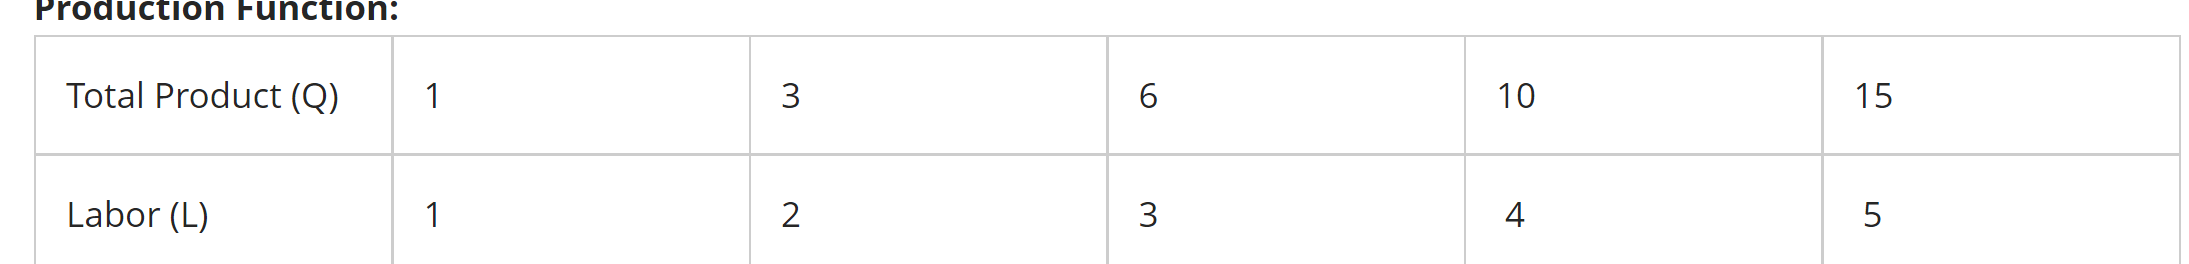
1. Using the production function, compute the figures for marginal product using the definition given earlier in this module. Draw a graph of the marginal product curve using the numbers you computed.
Suppose this firm can hire workers at a wage rate of $10 per hour to work in its factory which has a rental cost of $100. Use the production function to derive the cost function.
2. First compute the variable cost for Q = 0 through Q = 5.
3. Next compute the fixed cost for Q = 0 through Q = 5.
4. Then compute the total cost for Q = 0 through Q = 5. This is the cost function.
5. Finally compute the marginal cost for Q = 0 through Q = 5. Draw the marginal cost curve and compare it to the marginal product curve above. Explain what you see.

Step by Step Solution
There are 3 Steps involved in it

Get step-by-step solutions from verified subject matter experts