

Question: #1. Using the provided Excel sheet for polymer flooding answer the following questions. Provide graphs that justify your answers. a. Test the following initial
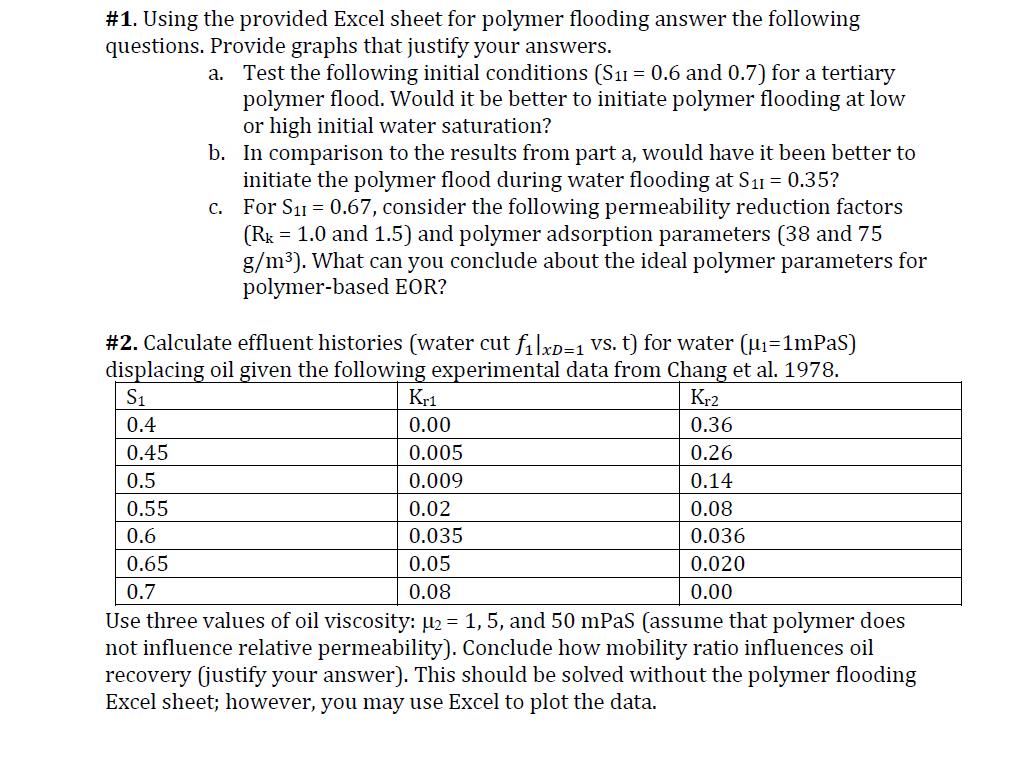
#1. Using the provided Excel sheet for polymer flooding answer the following questions. Provide graphs that justify your answers. a. Test the following initial conditions (S11 = 0.6 and 0.7) for a tertiary polymer flood. Would it be better to initiate polymer flooding at low or high initial water saturation? b. In comparison to the results from part a, would have it been better to initiate the polymer flood during water flooding at S11 = 0.35? C. For S = 0.67, consider the following permeability reduction factors (Rk = 1.0 and 1.5) and polymer adsorption parameters (38 and 75 g/m). What can you conclude about the ideal polymer parameters for polymer-based EOR? #2. Calculate effluent histories (water cut filxD=1 vs. t) for water (u=1mPas) displacing oil given the following experimental data from Chang et al. 1978. S1 0.4 0.45 0.5 0.55 0.6 0.65 0.7 Kr1 0.00 0.005 0.009 0.02 0.035 0.05 0.08 Kr2 0.36 0.26 0.14 0.08 0.036 0.020 0.00 Use three values of oil viscosity: 2 = 1, 5, and 50 mPaS (assume that polymer does not influence relative permeability). Conclude how mobility ratio influences oil recovery (justify your answer). This should be solved without the polymer flooding Excel sheet; however, you may use Excel to plot the data.
Step by Step Solution
There are 3 Steps involved in it
To tackle the questions provided lets break them down one by one and address them Question 1 a Testi... View full answer

Get step-by-step solutions from verified subject matter experts