

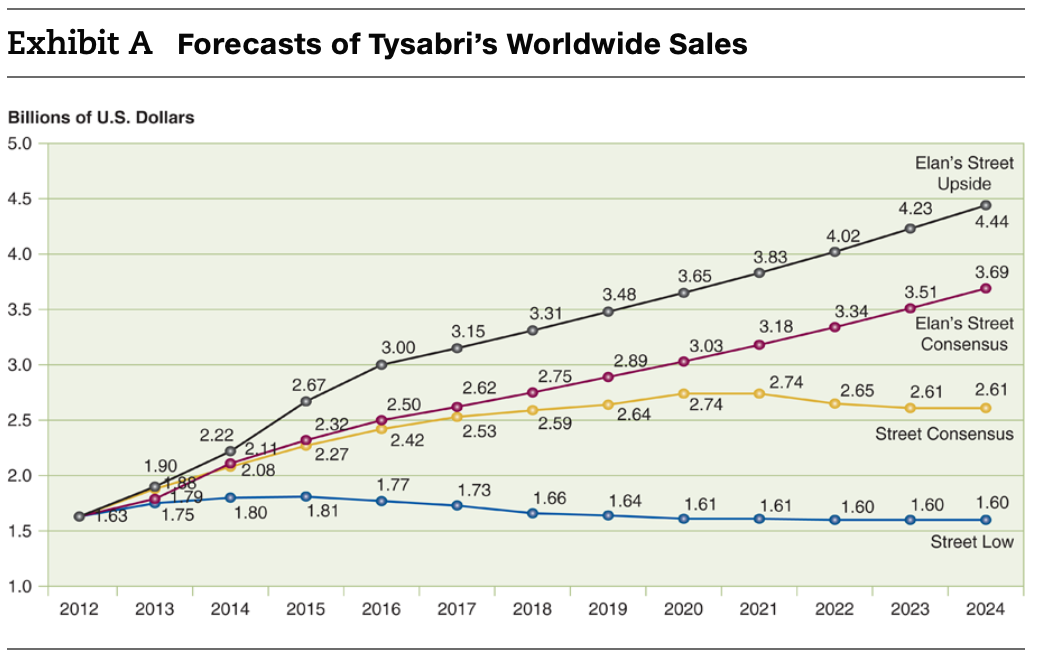
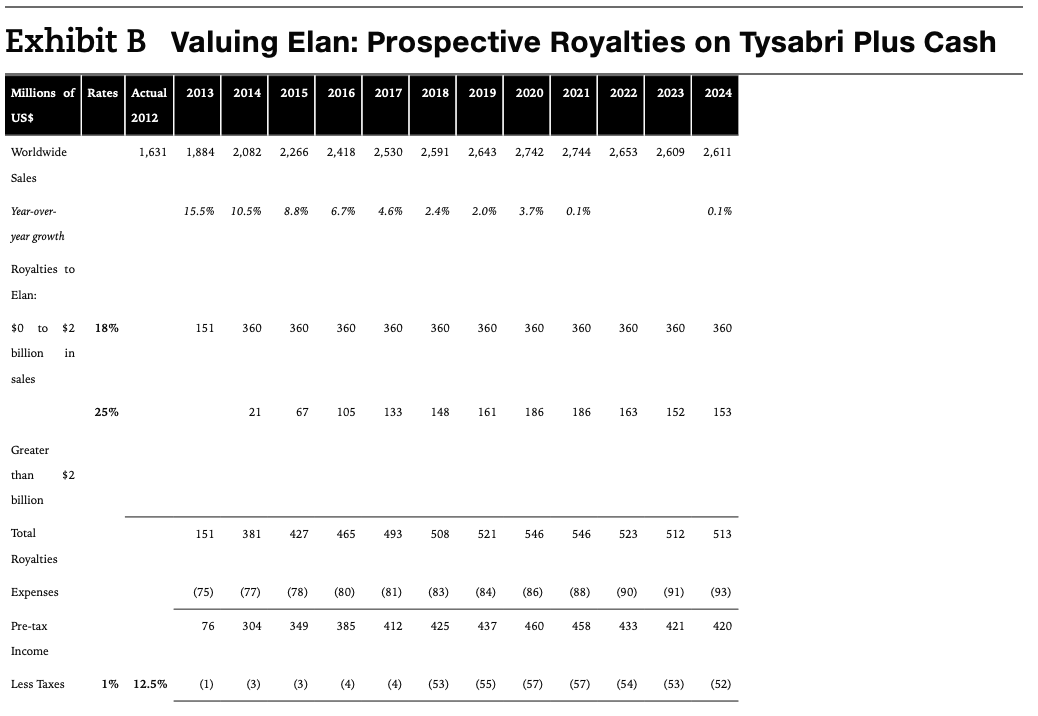
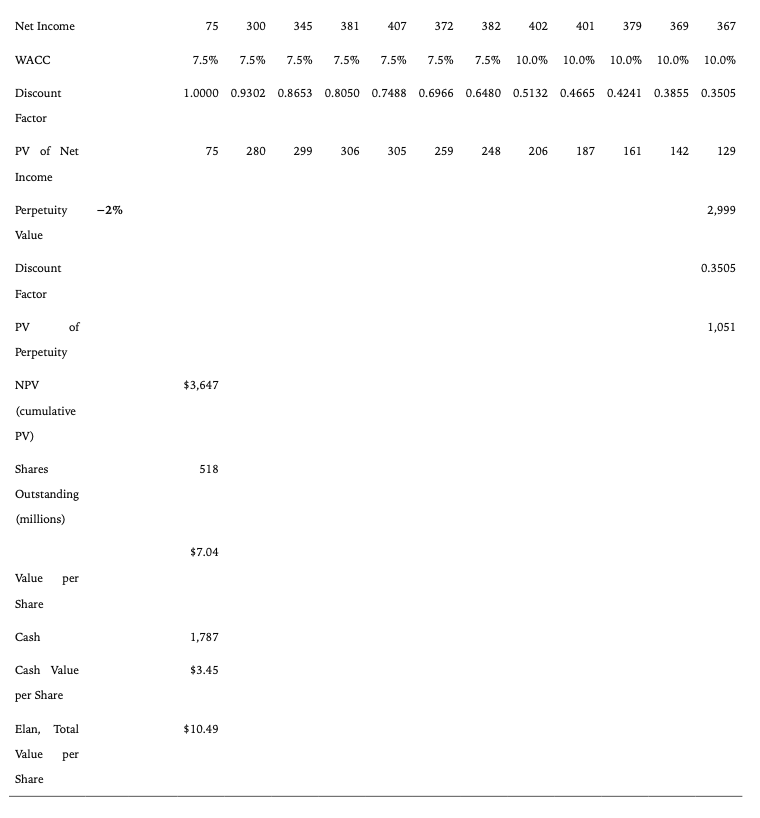
Question: 1. Using the sales forecasts for Tysabri presented in Exhibit A, and using the discounted cash flow model presented in Exhibit B, what do you
1. Using the sales forecasts for Tysabri presented in Exhibit A, and using the discounted cash flow model presented in Exhibit B, what do you think Elan is worth?
2. What other considerations do you think should be included in the valuation of Elan?
3. What would be your recommendation to shareholdersto approve managements proposals killing RPs offeror say no to the proposals, probably prompting the acceptance of RPs offer?
Answer all 3 questions! Please and thank you very much!
Exhibit A Forecasts of Tysabri's Worldwide Sales Billions of U.S. Dollars 5.0 4.5 Elan's Street Upside 4.23 4.44 4.02 4.0 3.83 3.65 3.69 3.48 3.51 3.5 3.31 3.34 3.15 3.18 Elan's Street Consensus 3.00 3.03 3.0 2.89 2.67 2.75 2.62 2.74 2.65 2.61 2.61 2.50 2.74 2.5 2.64 2.32 2.27 2.53 2.59 2.42 Street Consensus 2.0 2.22 2.11 1.90 2.08 179 1.75 1.80 OF 88 1.77 O 1.73 1.66 1.64 1.61 1.61 1.81 1.60 1.60 1.60 1.03 1.5 Street Low 1.0 2012 2013 2014 2015 2016 2017 2018 2019 2020 2021 2022 2023 2024 Exhibit B Valuing Elan: Prospective Royalties on Tysabri Plus Cash Millions of Rates Actual 2013 2014 2015 2016 2017 2018 2019 2020 2021 2022 2023 2024 US$ 2012 Worldwide 1,631 1,884 2,082 2,266 2,418 2,530 2,591 2,643 2,742 2,744 2,653 2,609 2,611 Sales Year-over- 15.5% 10.5% 8.8% 6.7% 4.6% 2.4% 2.0% 3.7% 0.1% 0.1% year growth Royalties to Elan: $0 to $2 18% 151 360 360 360 360 360 360 360 360 360 360 360 billion in sales 25% 2167 105 133 148 161 186 186 163 152 153 Greater than $2 billion Total 151 381 427 465 493 508 521 546 546 523 512 513 Royalties Expenses (75) ( (77) (78) (80) (81) (83) (84) (86) (88) (90) (91) (93) Pre-tax 76 304 349 385 412 425 437 460 458 433 421 420 Income Less Taxes 1% 12.5% (1) (3) (3) (53) (55) (57) (57) (54) (53) (52) Net Income 75 300 345 381 407 372 382 402 401 379 369 367 WACC 7.5% 7.5% 7.5% 7.5% 7.5% 7.5% 7.5% 10.0% 10.0% 10.0% 10.0% 10.0% Discount 1.0000 0.9302 0.8653 0.8050 0.7488 0.6966 0.6480 0.5132 0.4665 0.4241 0.3855 0.3505 Factor PV of Net 75 280 299 306 305 259 248 206 187 161 142 129 Income Perpetuity -2% 2,999 Value Discount 0.3505 Factor 1,051 PV of Perpetuity NPV $3,647 (cumulative PV) Shares 518 Outstanding (millions) $7.04 Value per Share Cash 1,787 $3.45 Cash Value per Share Elan, Total $10.49 Value per Share Exhibit A Forecasts of Tysabri's Worldwide Sales Billions of U.S. Dollars 5.0 4.5 Elan's Street Upside 4.23 4.44 4.02 4.0 3.83 3.65 3.69 3.48 3.51 3.5 3.31 3.34 3.15 3.18 Elan's Street Consensus 3.00 3.03 3.0 2.89 2.67 2.75 2.62 2.74 2.65 2.61 2.61 2.50 2.74 2.5 2.64 2.32 2.27 2.53 2.59 2.42 Street Consensus 2.0 2.22 2.11 1.90 2.08 179 1.75 1.80 OF 88 1.77 O 1.73 1.66 1.64 1.61 1.61 1.81 1.60 1.60 1.60 1.03 1.5 Street Low 1.0 2012 2013 2014 2015 2016 2017 2018 2019 2020 2021 2022 2023 2024 Exhibit B Valuing Elan: Prospective Royalties on Tysabri Plus Cash Millions of Rates Actual 2013 2014 2015 2016 2017 2018 2019 2020 2021 2022 2023 2024 US$ 2012 Worldwide 1,631 1,884 2,082 2,266 2,418 2,530 2,591 2,643 2,742 2,744 2,653 2,609 2,611 Sales Year-over- 15.5% 10.5% 8.8% 6.7% 4.6% 2.4% 2.0% 3.7% 0.1% 0.1% year growth Royalties to Elan: $0 to $2 18% 151 360 360 360 360 360 360 360 360 360 360 360 billion in sales 25% 2167 105 133 148 161 186 186 163 152 153 Greater than $2 billion Total 151 381 427 465 493 508 521 546 546 523 512 513 Royalties Expenses (75) ( (77) (78) (80) (81) (83) (84) (86) (88) (90) (91) (93) Pre-tax 76 304 349 385 412 425 437 460 458 433 421 420 Income Less Taxes 1% 12.5% (1) (3) (3) (53) (55) (57) (57) (54) (53) (52) Net Income 75 300 345 381 407 372 382 402 401 379 369 367 WACC 7.5% 7.5% 7.5% 7.5% 7.5% 7.5% 7.5% 10.0% 10.0% 10.0% 10.0% 10.0% Discount 1.0000 0.9302 0.8653 0.8050 0.7488 0.6966 0.6480 0.5132 0.4665 0.4241 0.3855 0.3505 Factor PV of Net 75 280 299 306 305 259 248 206 187 161 142 129 Income Perpetuity -2% 2,999 Value Discount 0.3505 Factor 1,051 PV of Perpetuity NPV $3,647 (cumulative PV) Shares 518 Outstanding (millions) $7.04 Value per Share Cash 1,787 $3.45 Cash Value per Share Elan, Total $10.49 Value per Share
Step by Step Solution
There are 3 Steps involved in it

Get step-by-step solutions from verified subject matter experts