Question: 1. Using the SPSS output file contained in Question 1, the Pearson Correlation Coefficient (R), the measure that determines the strength of the correlation between
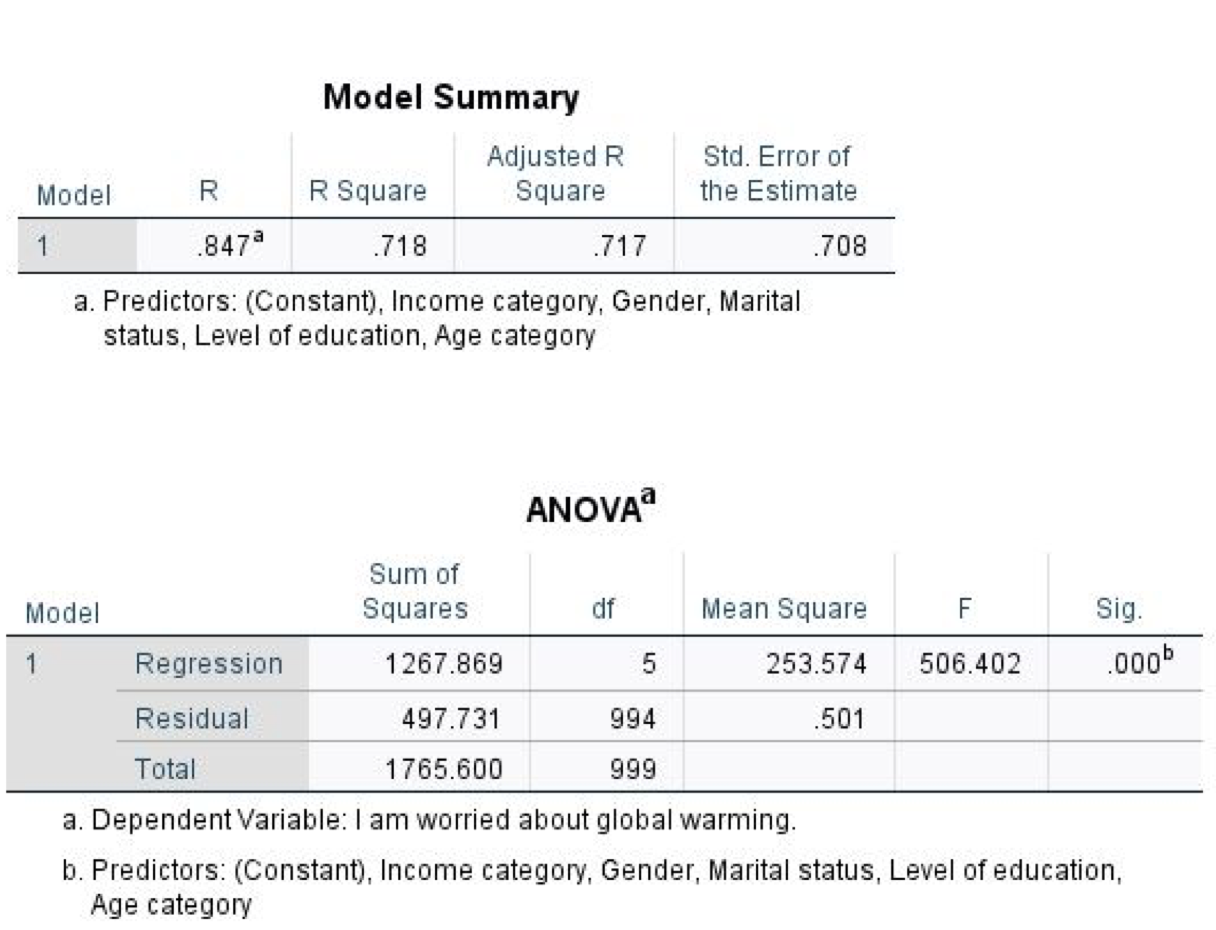
1. Using the SPSS output file contained in Question 1, the Pearson Correlation Coefficient (R), the measure that determines the strength of the correlation between our independent variables to our dependent variable (I am worried about global warming), has been determined to be 0.847 indicating a _____________ relationship between our dependent variable and our independent variables!
- A. very strong
- B. weak
- C. very weak
- D. no relationship
2. Using the SPSS output file contained in Question 1, the R Square value of 0.718 indicates a strong relationship between the independent variables and our dependent variable. This value indicates that ____________ percent of our dependent variable (Y) is explained by our independent variables (X's).
- A. 25
- B. 65.5
- C. 71.8
- D. 100
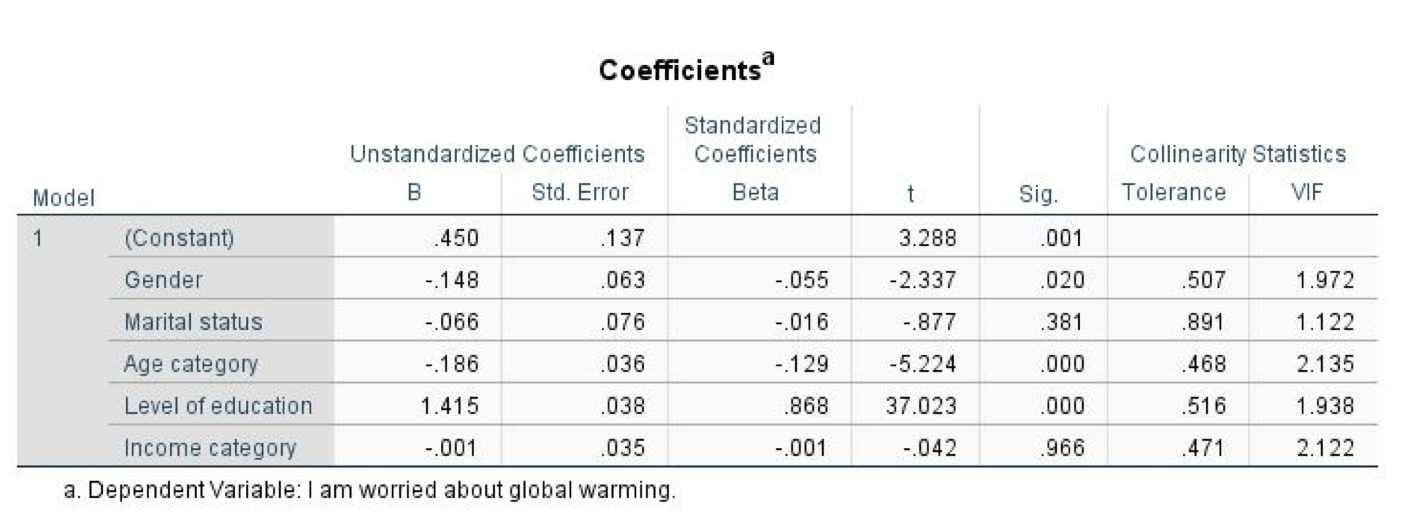
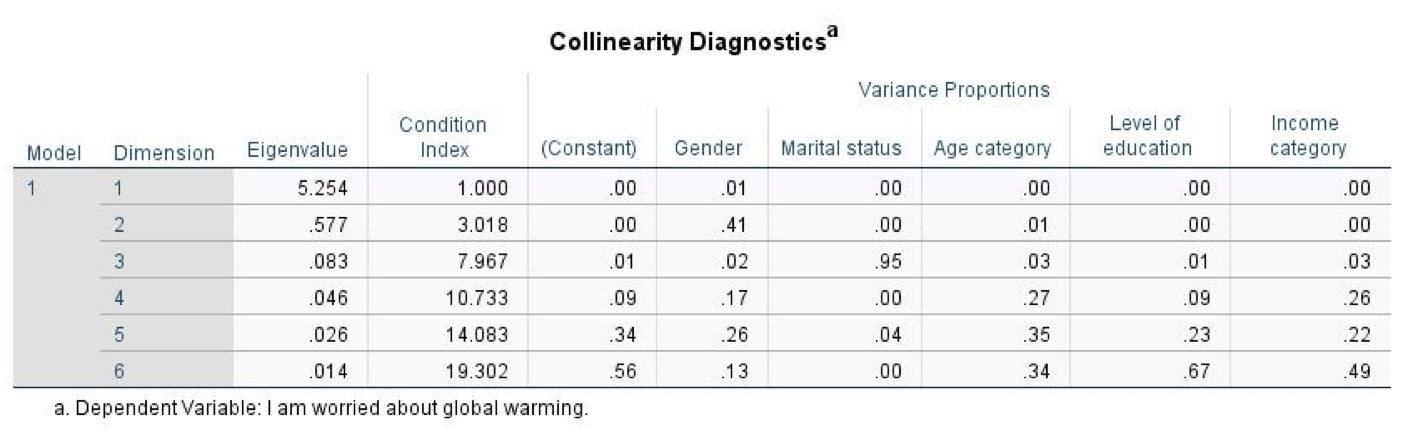
Model Summary Adjusted R Square Std. Error of the Estimate Model R R Square 1 .847a .718 .717 .708 a. Predictors: (Constant), Income category, Gender, Marital status, Level of education, Age category ANOVA Sum of Squares Model df Mean Square F Sig. .000 1 Regression 1267.869 5 253.574 506.402 Residual 497.731 994 .501 Total 1765.600 999 a. Dependent Variable: I am worried about global warming. b. Predictors: (Constant), Income category, Gender, Marital status, Level of education, Age category Coefficients a Standardized Coefficients Unstandardized Coefficients Collinearity Statistics Tolerance VIF Model B Std. Error Beta t Sig. 1 .450 .137 3.288 .001 (Constant) Gender -.148 .063 -.055 -2.337 .020 .507 1.972 Marital status -.066 .076 -.016 -.877 .381 891 1.122 - 129 -5.224 .000 468 2.135 .868 37.023 .000 .516 1.938 Age category -.186 .036 Level of education 1.415 .038 Income category .035 a. Dependent Variable: I am worried about global warming. -.001 -.001 -.042 1966 471 2.122 Collinearity Diagnostics Variance Proportions Condition Index Level of education Income category Model Dimension Eigenvalue (Constant) Gender Marital status Age category 1 1 5.254 1.000 .00 .01 .00 .00 .00 .00 2 .577 3.018 .00 41 .00 .01 .00 .00 3 .083 7.967 .01 .02 .95 .03 .01 .03 4 .046 10.733 .09 .17 .00 .27 .09 .26 5 .026 14.083 34 .26 .04 .35 .23 .22 6 .014 19.302 .56 .13 .00 .34 .67 .49 a. Dependent Variable: I am worried about global warming


