

Question: 1 Using the supply schedule in the table below, draw the supply curve for slices of pizza in a university town. table [ [
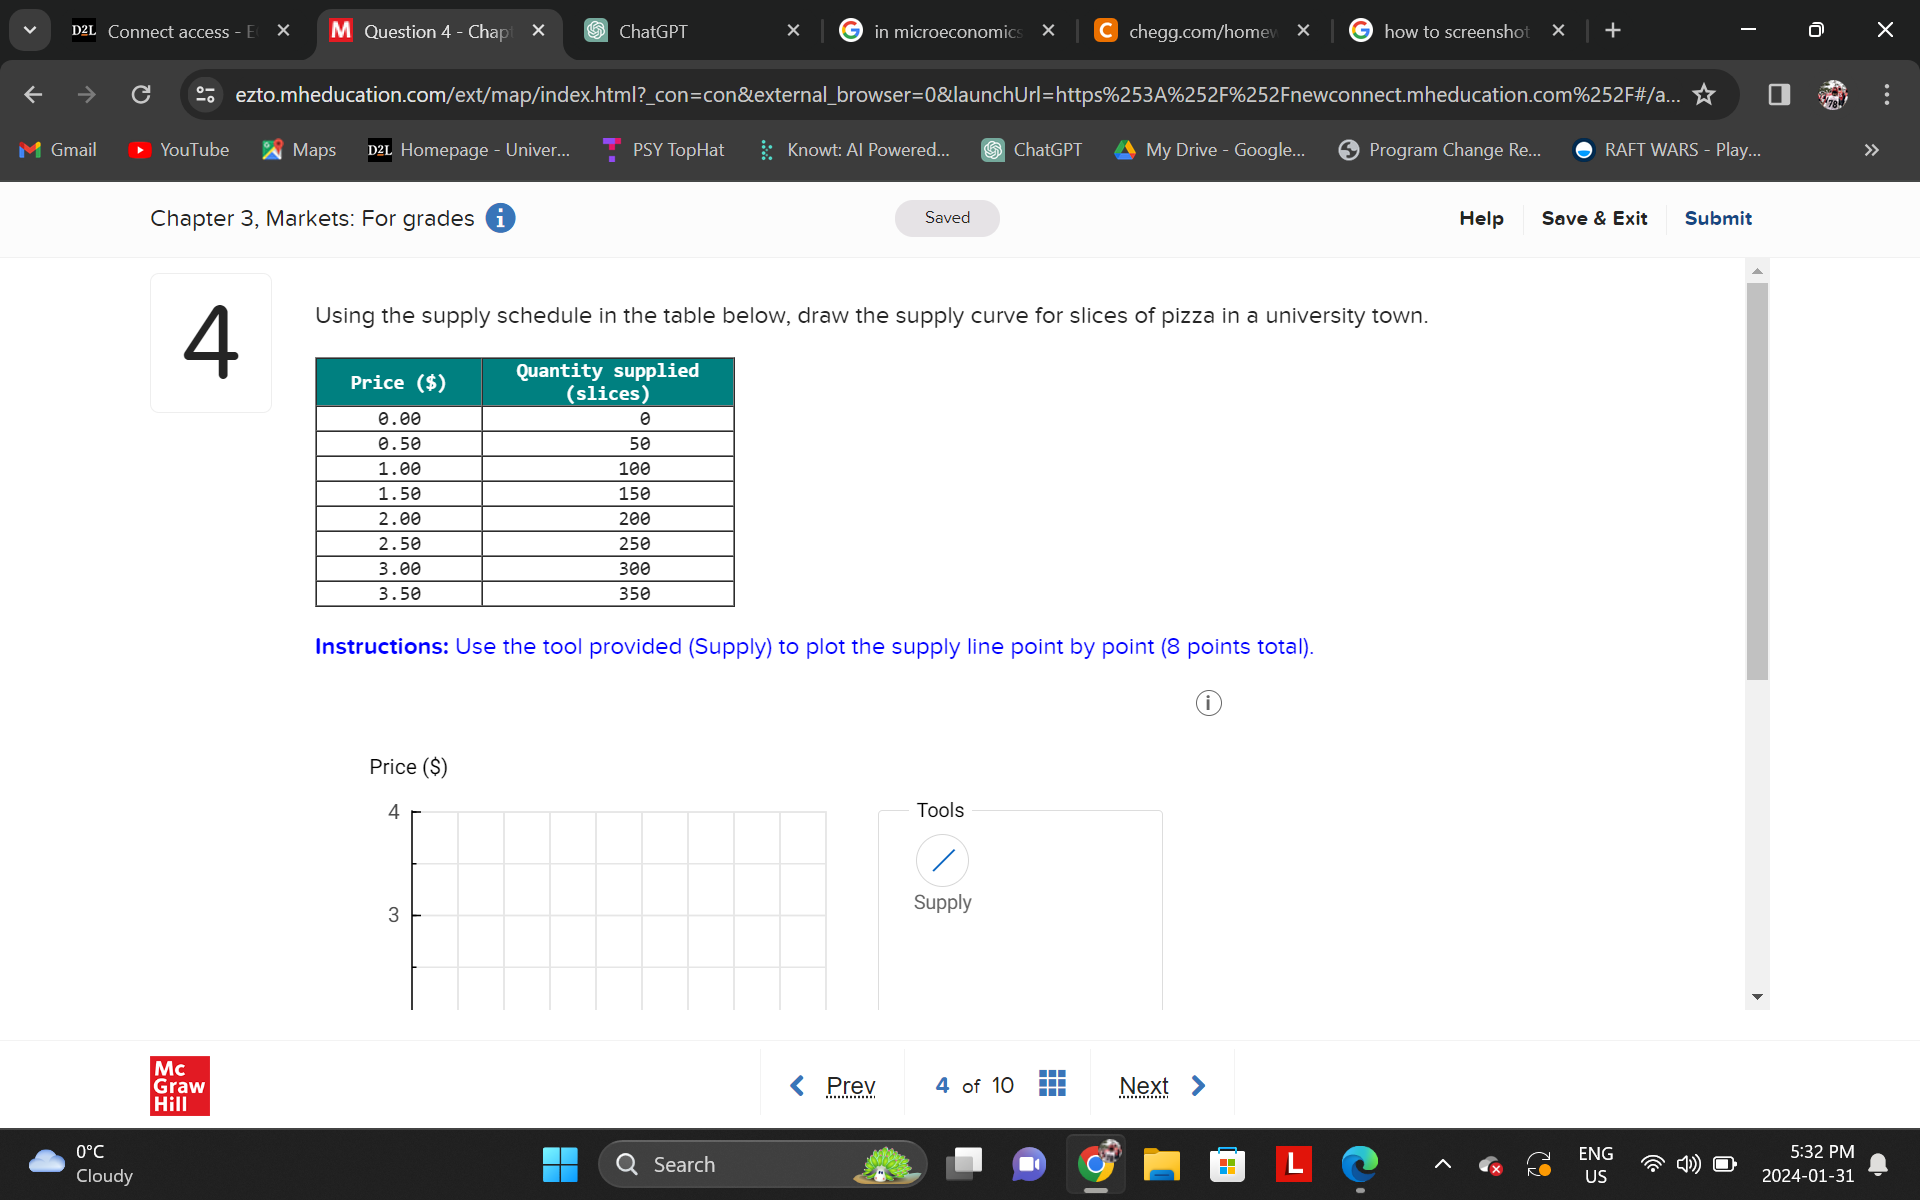
Using the supply schedule in the table below, draw the supply curve for slices of pizza in a university town.
tablePrice $tableQuantity suppliedslices
Instructions: Use the tool provided Supply to plot the supply line point by point points total
Step by Step Solution
There are 3 Steps involved in it
1 Expert Approved Answer
Step: 1 Unlock

Question Has Been Solved by an Expert!
Get step-by-step solutions from verified subject matter experts
Step: 2 Unlock
Step: 3 Unlock