

Question: 1. Using the values obtained in #1, sketch a graph to represent the skewness of the data points. Explain the skewness of your graph. 2.
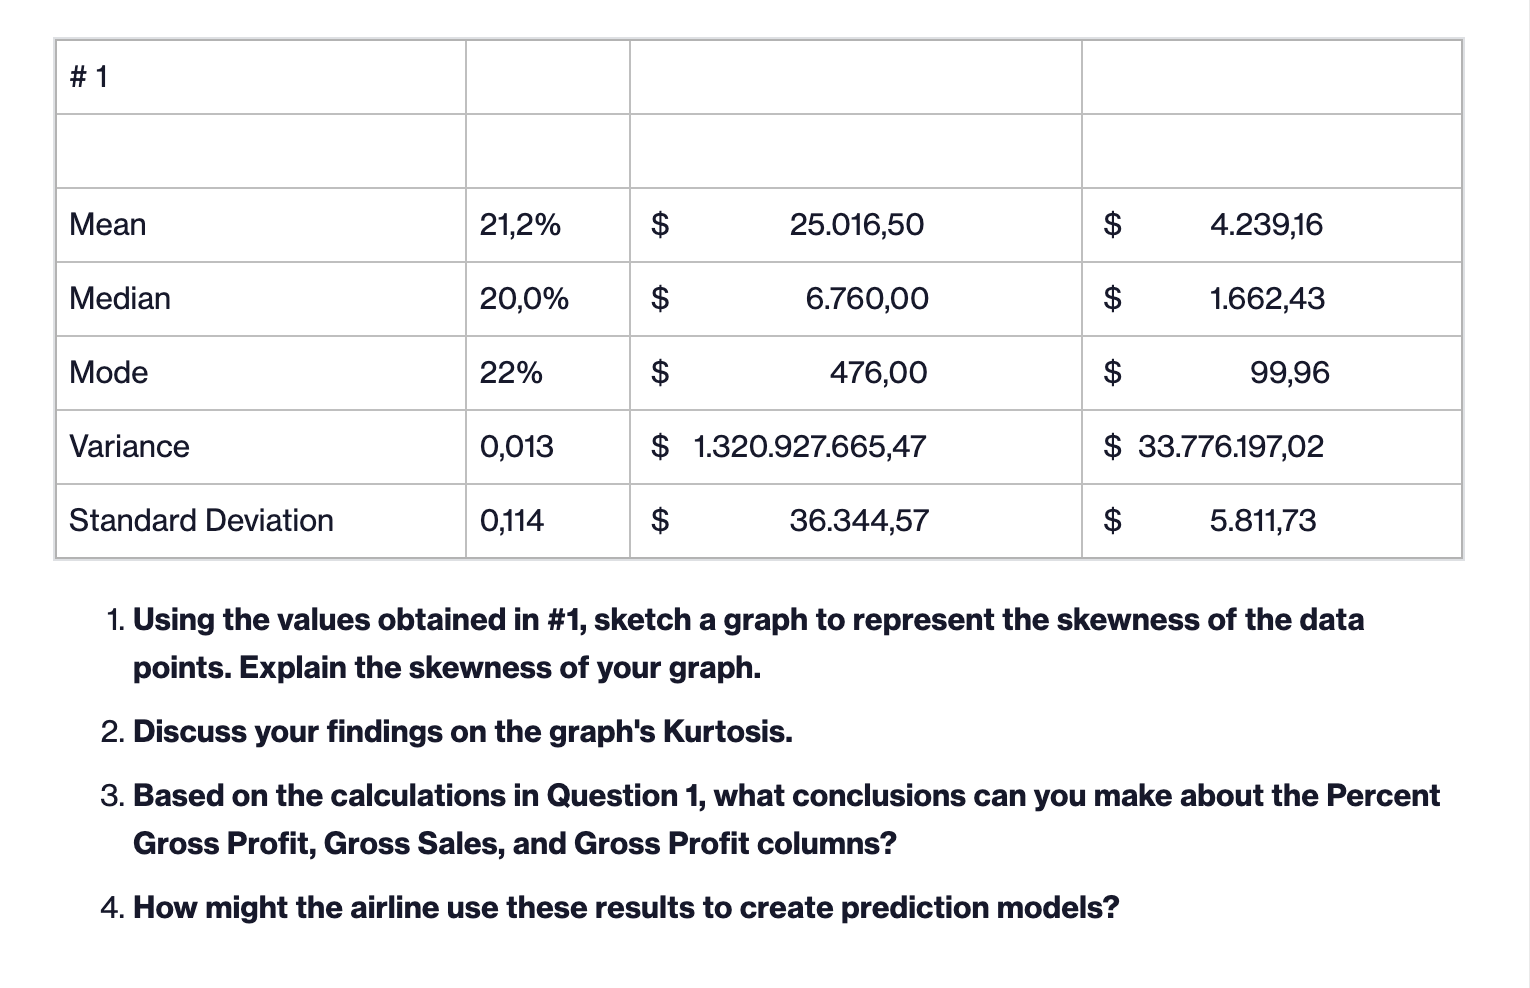
1. Using the values obtained in #1, sketch a graph to represent the skewness of the data points. Explain the skewness of your graph. 2. Discuss your findings on the graph's Kurtosis. 3. Based on the calculations in Question 1, what conclusions can you make about the Percent Gross Profit, Gross Sales, and Gross Profit columns? 4. How might the airline use these results to create prediction models? 1. Using the values obtained in #1, sketch a graph to represent the skewness of the data points. Explain the skewness of your graph. 2. Discuss your findings on the graph's Kurtosis. 3. Based on the calculations in Question 1, what conclusions can you make about the Percent Gross Profit, Gross Sales, and Gross Profit columns? 4. How might the airline use these results to create prediction models
Step by Step Solution
There are 3 Steps involved in it

Get step-by-step solutions from verified subject matter experts