

Question: Really need help on this. 1 Using the values obtained in #1, sketch a graph to represent the skewness of the data points. Explain the
Really need help on this. 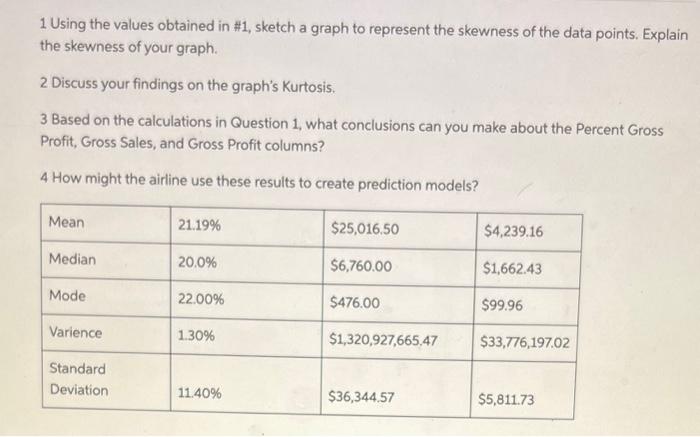
1 Using the values obtained in #1, sketch a graph to represent the skewness of the data points. Explain the skewness of your graph. 2 Discuss your findings on the graph's Kurtosis. 3 Based on the calculations in Question 1, what conclusions can you make about the Percent Gross Profit, Gross Sales, and Gross Profit columns? 4 How might the airline use these results to create prediction models? 1 Using the values obtained in #1, sketch a graph to represent the skewness of the data points. Explain the skewness of your graph. 2 Discuss your findings on the graph's Kurtosis. 3 Based on the calculations in Question 1, what conclusions can you make about the Percent Gross Profit, Gross Sales, and Gross Profit columns? 4 How might the airline use these results to create prediction models
Step by Step Solution
There are 3 Steps involved in it
1 Expert Approved Answer
Step: 1 Unlock

Question Has Been Solved by an Expert!
Get step-by-step solutions from verified subject matter experts
Step: 2 Unlock
Step: 3 Unlock