

Question: 1. What do these visualizations show? 2. How might these observations affect our risk assessment? 3400B Visualization and Description 1 Bar Charts of Pricing Methodologies
1. What do these visualizations show?
2. How might these observations affect our risk assessment?
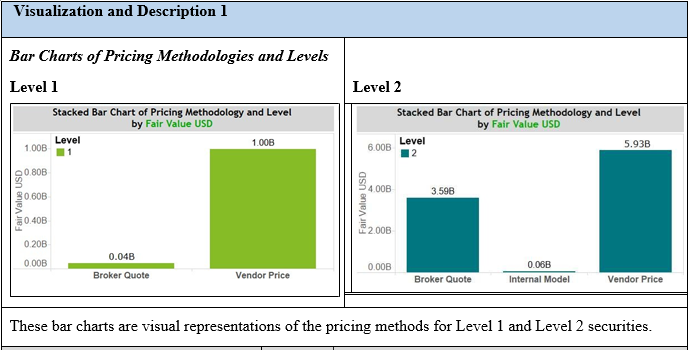
3400B Visualization and Description 1 Bar Charts of Pricing Methodologies and Levels Level 1 Stacked Bar Chart of Pricing Methodology and Level by Fair Value USD Level 1.00B Level 2 Stacked Bar Chart of Pricing Methodology and Level by Fair Value USD Level 6.00B 5.93B 12 100B 11 0.80B 30.60B 3.596 air Value USD Fair Value USD 0.40B 12.000 0.20B 0.04B 0.00B 0.00B Broker Quote Vendor Price 0.06B Internal Model Broker Quote Vendor Price These bar charts are visual representations of the pricing methods for Level 1 and Level 2 securities
Step by Step Solution
There are 3 Steps involved in it

Get step-by-step solutions from verified subject matter experts