

Question: 1. What does the command plot(x, y, u, v) do? a. It plots the two given vectors on a normal chart. b. It plots the
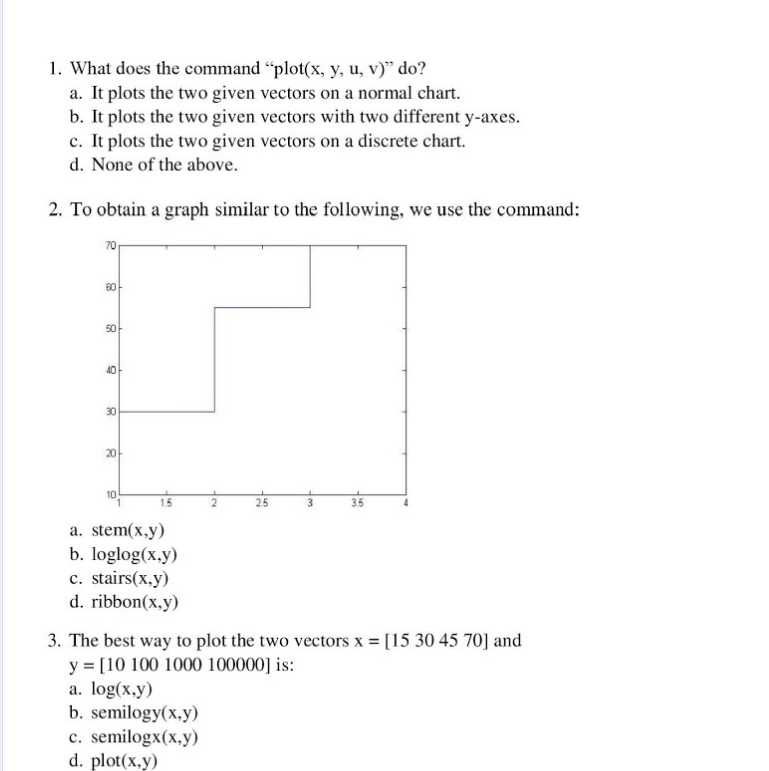
1. What does the command "plot(x, y, u, v) do? a. It plots the two given vectors on a normal chart. b. It plots the two given vectors with two different y-axes. c. It plots the two given vectors on a discrete chart. d. None of the above. 2. To obtain a graph similar to the following, we use the command: 70 60 50 40 30 20 10 a. stem(x,y) b. loglog(x,y) C. stairs(x,y) d. ribbon(x,y) 3. The best way to plot the two vectors x = [15 30 45 70) and y = [10 100 1000 100000] is: a. log(x,y) b. semilogy(x,y) c. semilogx(x,y) d. plot(x,y)
Step by Step Solution
There are 3 Steps involved in it
1 Expert Approved Answer
Step: 1 Unlock

Question Has Been Solved by an Expert!
Get step-by-step solutions from verified subject matter experts
Step: 2 Unlock
Step: 3 Unlock