

Question: Comm215/Sections AA and D Fall 2021 DAP. DAP Report Submission/Uploading deadline before 23:59:59 on the December 7 th , 2021. Objectives In the DAP: The
Comm215/Sections AA and D Fall 2021 DAP.
- DAP Report Submission/Uploading deadline before 23:59:59 on the December 7th, 2021.
Objectives In the DAP:
The data analysis assignment is designed to apply the basic statistical concepts learned in the course. You will be using techniques learned in this course in an applied setting. This project contains Region_X_Property.xlsx an EXCEL filedataset.
Important Points:
Software : You can use Excel with add-ins or MINITAB.
Must be typed & uploaded as a PDF file.
To be completed in groups of 5 people (all must be from the same Section)
- Due date
- Before 23:59:59 on the December 7th, 2021.
- Uploaded Via Moodle as an Assignment for each individual Section
Your submitted work should contain the following;
- 1- Cover page's with a title includes the group's Section
- Introduction: The introduction explains what you are doing and why within the context of your analysis. Give a description of the nature and the scope of the case, the importance of the problem and the need for its resolution.
Last Name Alphabetically
First Name
Student ID
2 - Table of content
3 - Your report, containing three brief paragraphs.
- Discussion: The discussion presents the results to the questions asked below (in the order in which they asked). You may refer to any tables, charts, illustrations you have included in your appendix (see below).
- Conclusion: The Conclusion draws inference about your results, and it is also where it will become clear if you have learned your material. Show what you know by giving insightful and relevant explanations of your results as well as any recommendations you may have. Use the results from asked questions to build a relevant story that will become yours.
Appendix- include all relevant tables, charts, results and illustrations required to answer the case questions and arrive to conclusion(s).
These must be organized in the order in which each question appears and Labelle with a brief and clear explanation below each table, charts, and results.
Finally the DAP printout should not be more than 12 pages in total.
You should copy and paste only the relevant results, such as graphs, charts, tables,...findings,... and illustrations. Not raw data.
NOTE!
Theprofessorreservestherighttodeductsomeorallpointsfromagroupprojectwhichdoesnotadheretotheabovecriteria
PleaserefertoyourcourseoutlineandreviewthesectionregardingAcademicIntegrityandPlagiarism!Some examplesofplagiarismare
o Copyingdirectlyorimproperlycitingtheworksofothers
o Participatedinunauthorizedcollaboration
o Payingtohavetheprojectcompleted
o Acceptingpaymentinordertoincludenon-participatingmembersintothegroup.
Grading Method:
Typed, Calibri & Font size 12pt.
1% for one page report on the analysis, including the final mathematical model
of the Total Value including the predicted value.
The remaining 7% goes for the 7 questions.
Project Description:
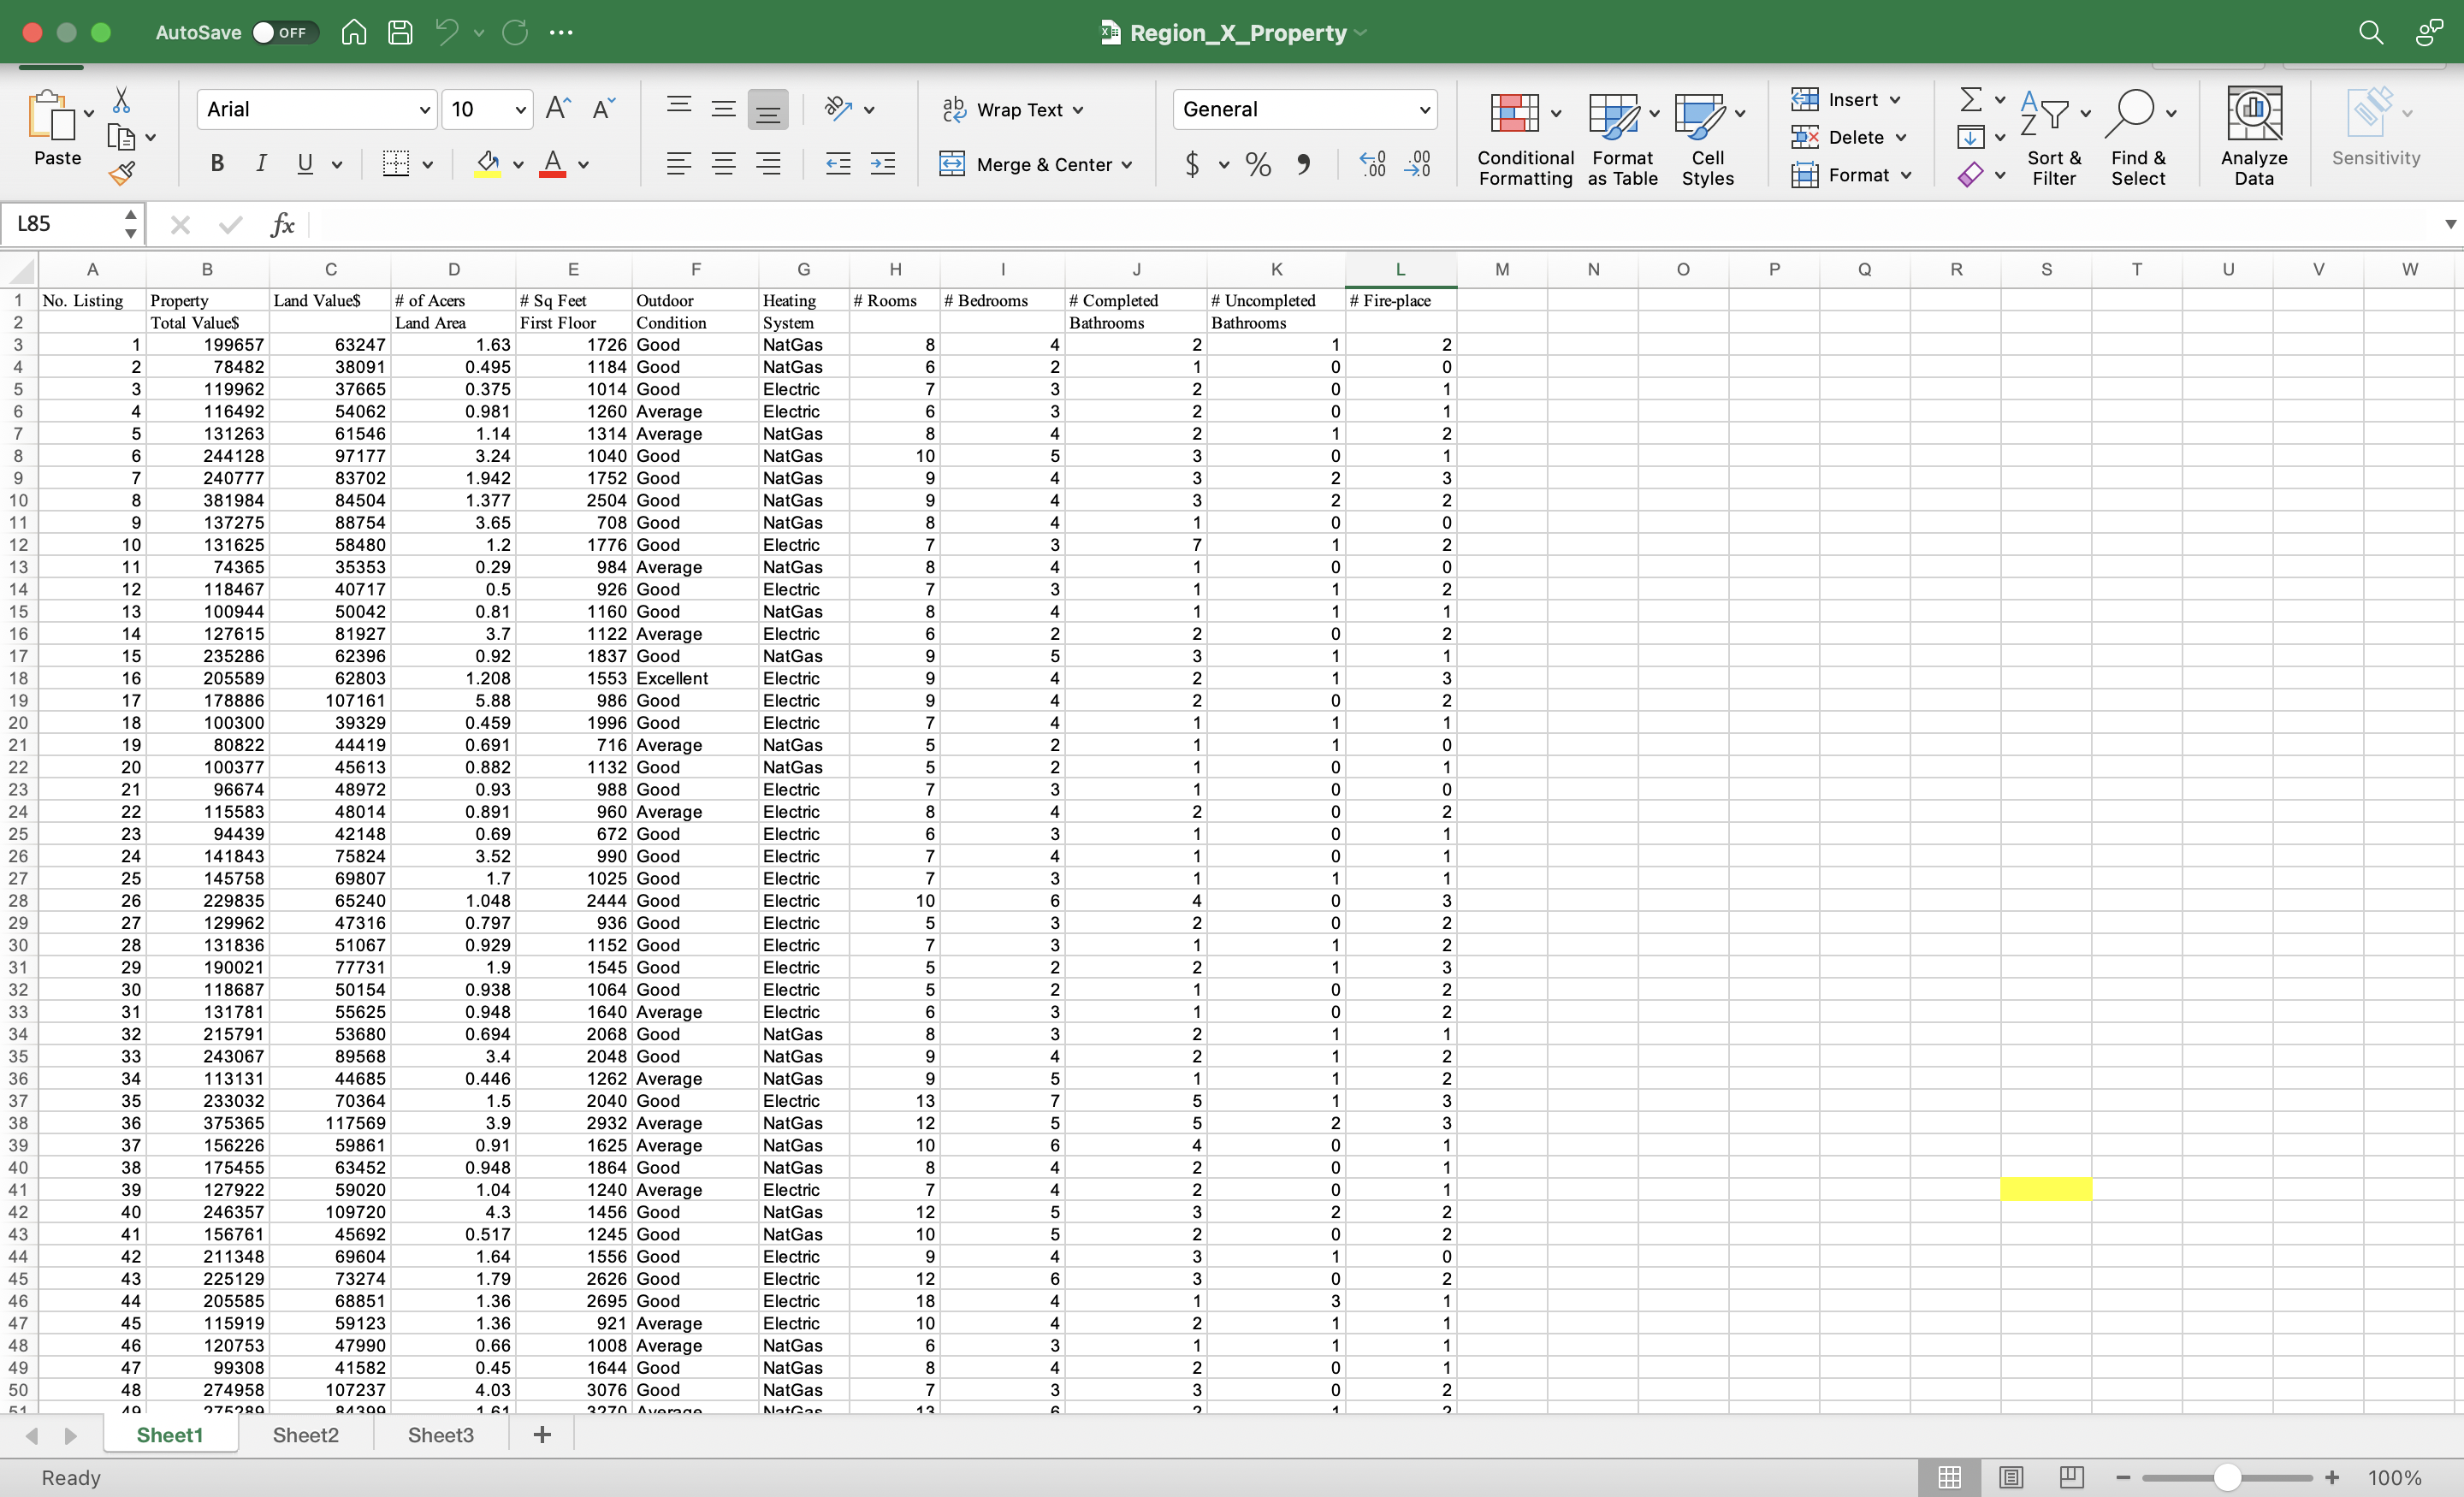
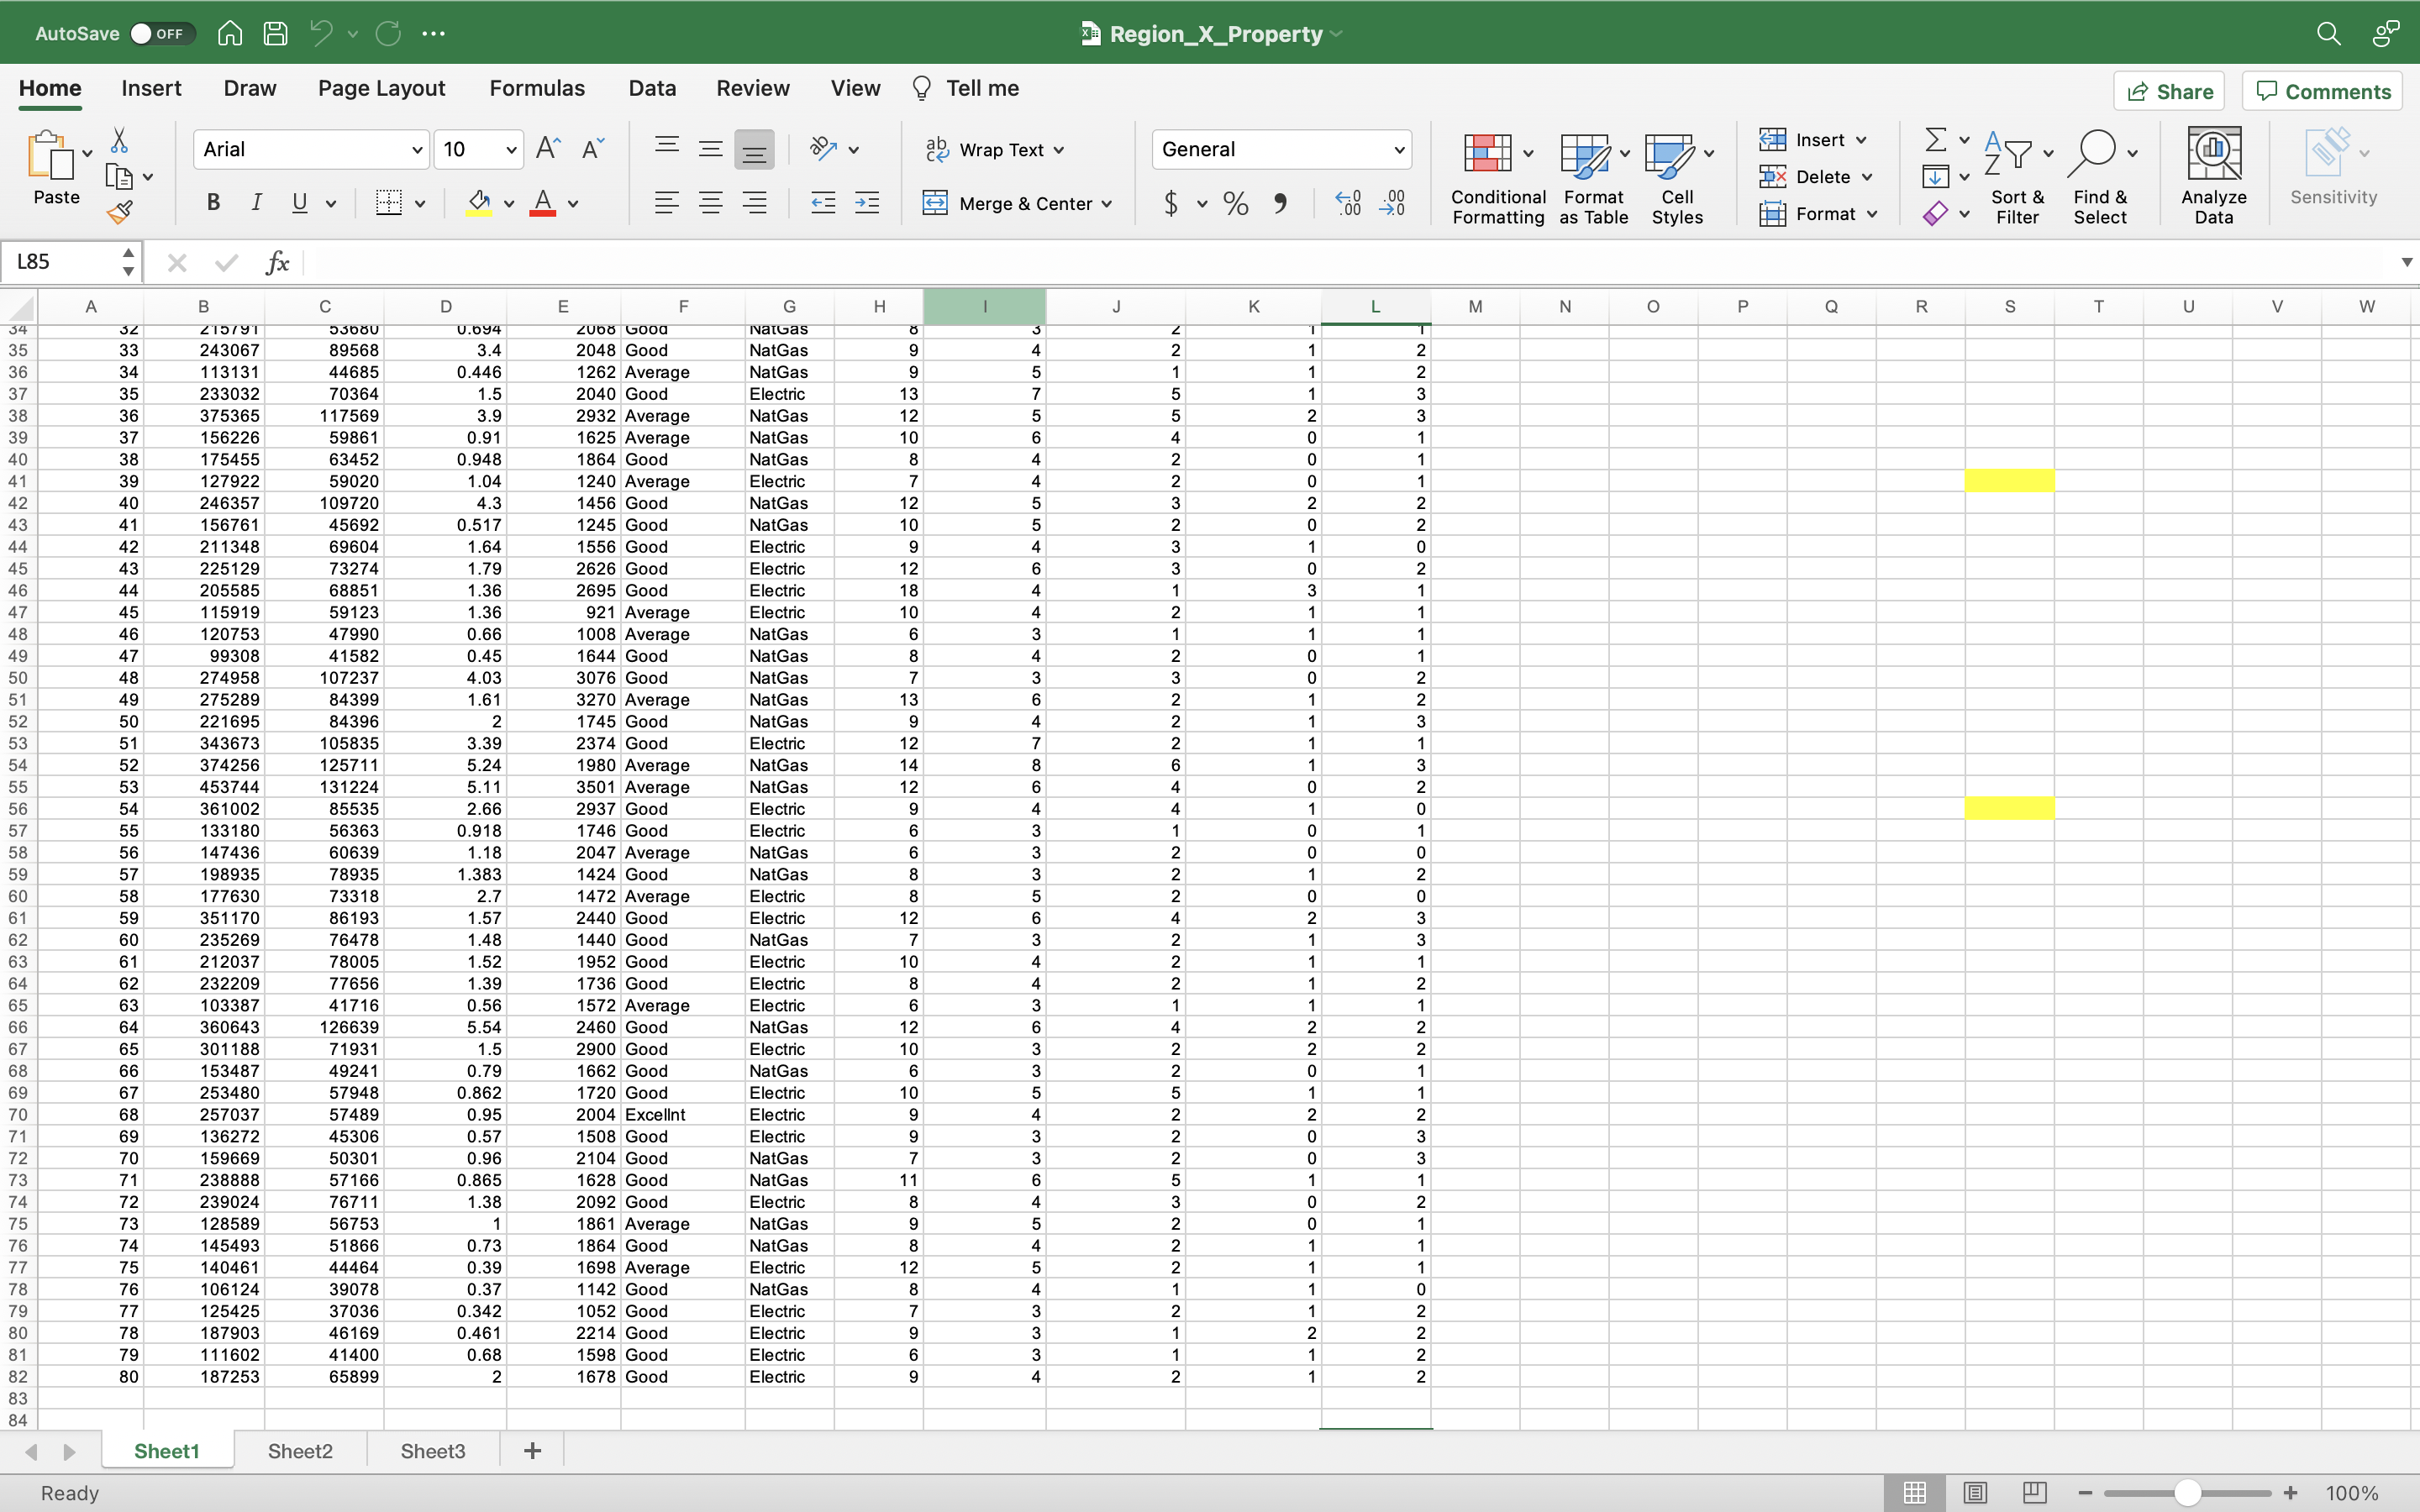
The Region_X_Property.xlsx dataset contains the following variables.
List of Variables:
Total Value, Land Value, # Acres Land Area, First floor Sq. Feet, Out door Condition, Heating System, # Rooms, # Bedrooms, # Completed Bathrooms,# of Uncompleted Bathroom and # Fire-place.
A Real Estate Company - REC, has hired your team as a consultant group to know what are the significant factors that influence determining the Total Value of a property in the
Region. In doing so REC expects your team to come up with a mathematical model to make reasonable projections of properties Total Value in the Region.
To complete this project your team members are given a random sample of 80 properties whith the following variables collected for each property:
Total Value, Land Value, # Acres Land Area, First floor Sq. Feet, Out door Condition, Heating System, # Rooms, # Bedrooms, # Completed Bathrooms,# of Uncompleted Bathroom and # Fire-place.
In your case study compute the 7 relevant questions (but you are not limited to)
1
Perform a comparative analysis of the Total Valueof houses up to 140,000 (List A) with those of at least 140,000 (List B), show the List with the less variable.
In your analysis, at least these three features should be explained ;
Shapes,... any outliers, measures of central tendencies and measures of dispersions. Interpret the results in the context of the problem
2
Use an appropriate graph to display Total Value (when n=80), interpret the shape and identify any outliers. Plot the Outside Condition,explain the scale of measurement for this variable also show the average for the Outside Condition.
3
Setup a contingency table between Heating Systemand # of Fire-place. Is there a significant relationship between these two variables( use =0.10). For those houses with at least 2 fire places set up a 95% confidence interval for the proportion of properties heated by the Natural Gas system.
4
At =0.10 test REC claims that in Region _X mean Land Valueis more than 15% of the average Total Value( based on the given data set).Explain your conclusion in the concept of the problem use the p- value approach. With the significant level set at 10% how strong sample evidence supportsREC's claim.
5
Perform a simple linear model between Total Value and # of Rooms (model 1) also
Total Value and First floor Sq.F (model 2). Which one of the two models do you recommend to REC and why?
6
Construct a correlation coefficient matrix, is there any multicolinearity problem
among the independent variables? If so show the two most strongly correlated variables.
7
Perform a multiple linear regression analysis between Total Value and the following list of predictors:
Land Value, Land Area, First floor Sq. Feet, Heating System, # Rooms, # Bedrooms, # Completed Bathrooms,# of Uncompleted Bathroom.
i) At = 5%, show whether the overall model is statistically significant.
ii) At significant level of =0.0 1 which variable (s) is (are) insignificant why?
Choose your final/cleaned modelto predict the Total Value for a house in Region _X with a Land value of 50,000$, 1000Sq.f, 1 Completed Bathroom and 1 Uncompleted Bathroom.
Step by Step Solution
There are 3 Steps involved in it

Get step-by-step solutions from verified subject matter experts