

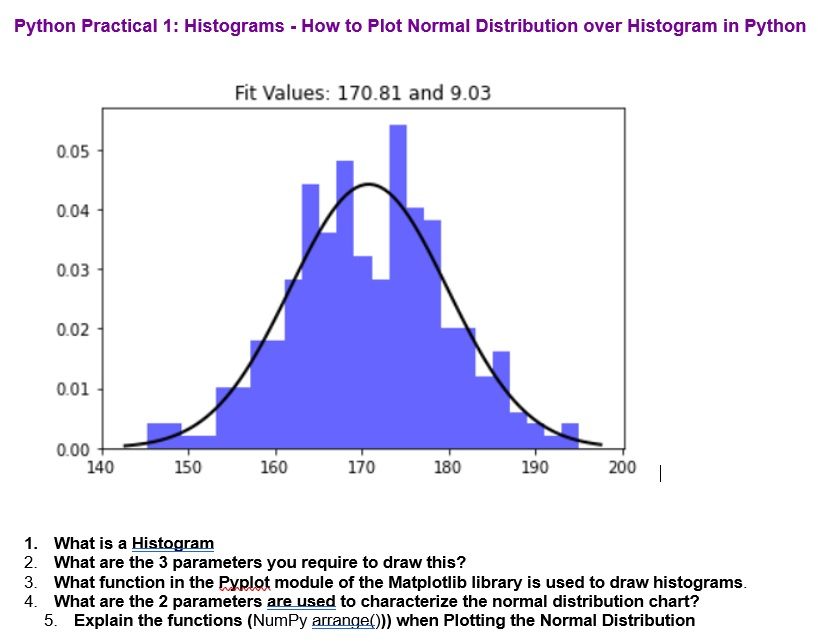
Question: 1 . What is a Histogram 2 . What are the 3 parameters you require to draw this? 3 . What function in the Pyplot
What is a Histogram
What are the parameters you require to draw this?
What function in the Pyplot module of the Matplotlib library is used to draw histograms.
What are the parameters are used to characterize the normal distribution chart?
Explain the functions NumPy arrange when Plotting the Normal Distribution
Step by Step Solution
There are 3 Steps involved in it
1 Expert Approved Answer
Step: 1 Unlock

Question Has Been Solved by an Expert!
Get step-by-step solutions from verified subject matter experts
Step: 2 Unlock
Step: 3 Unlock