Question: 1. What is the Return on Assets (ROA) over the 5 years of data? Any trends? From 2020 until 2015. 2. What is the Return
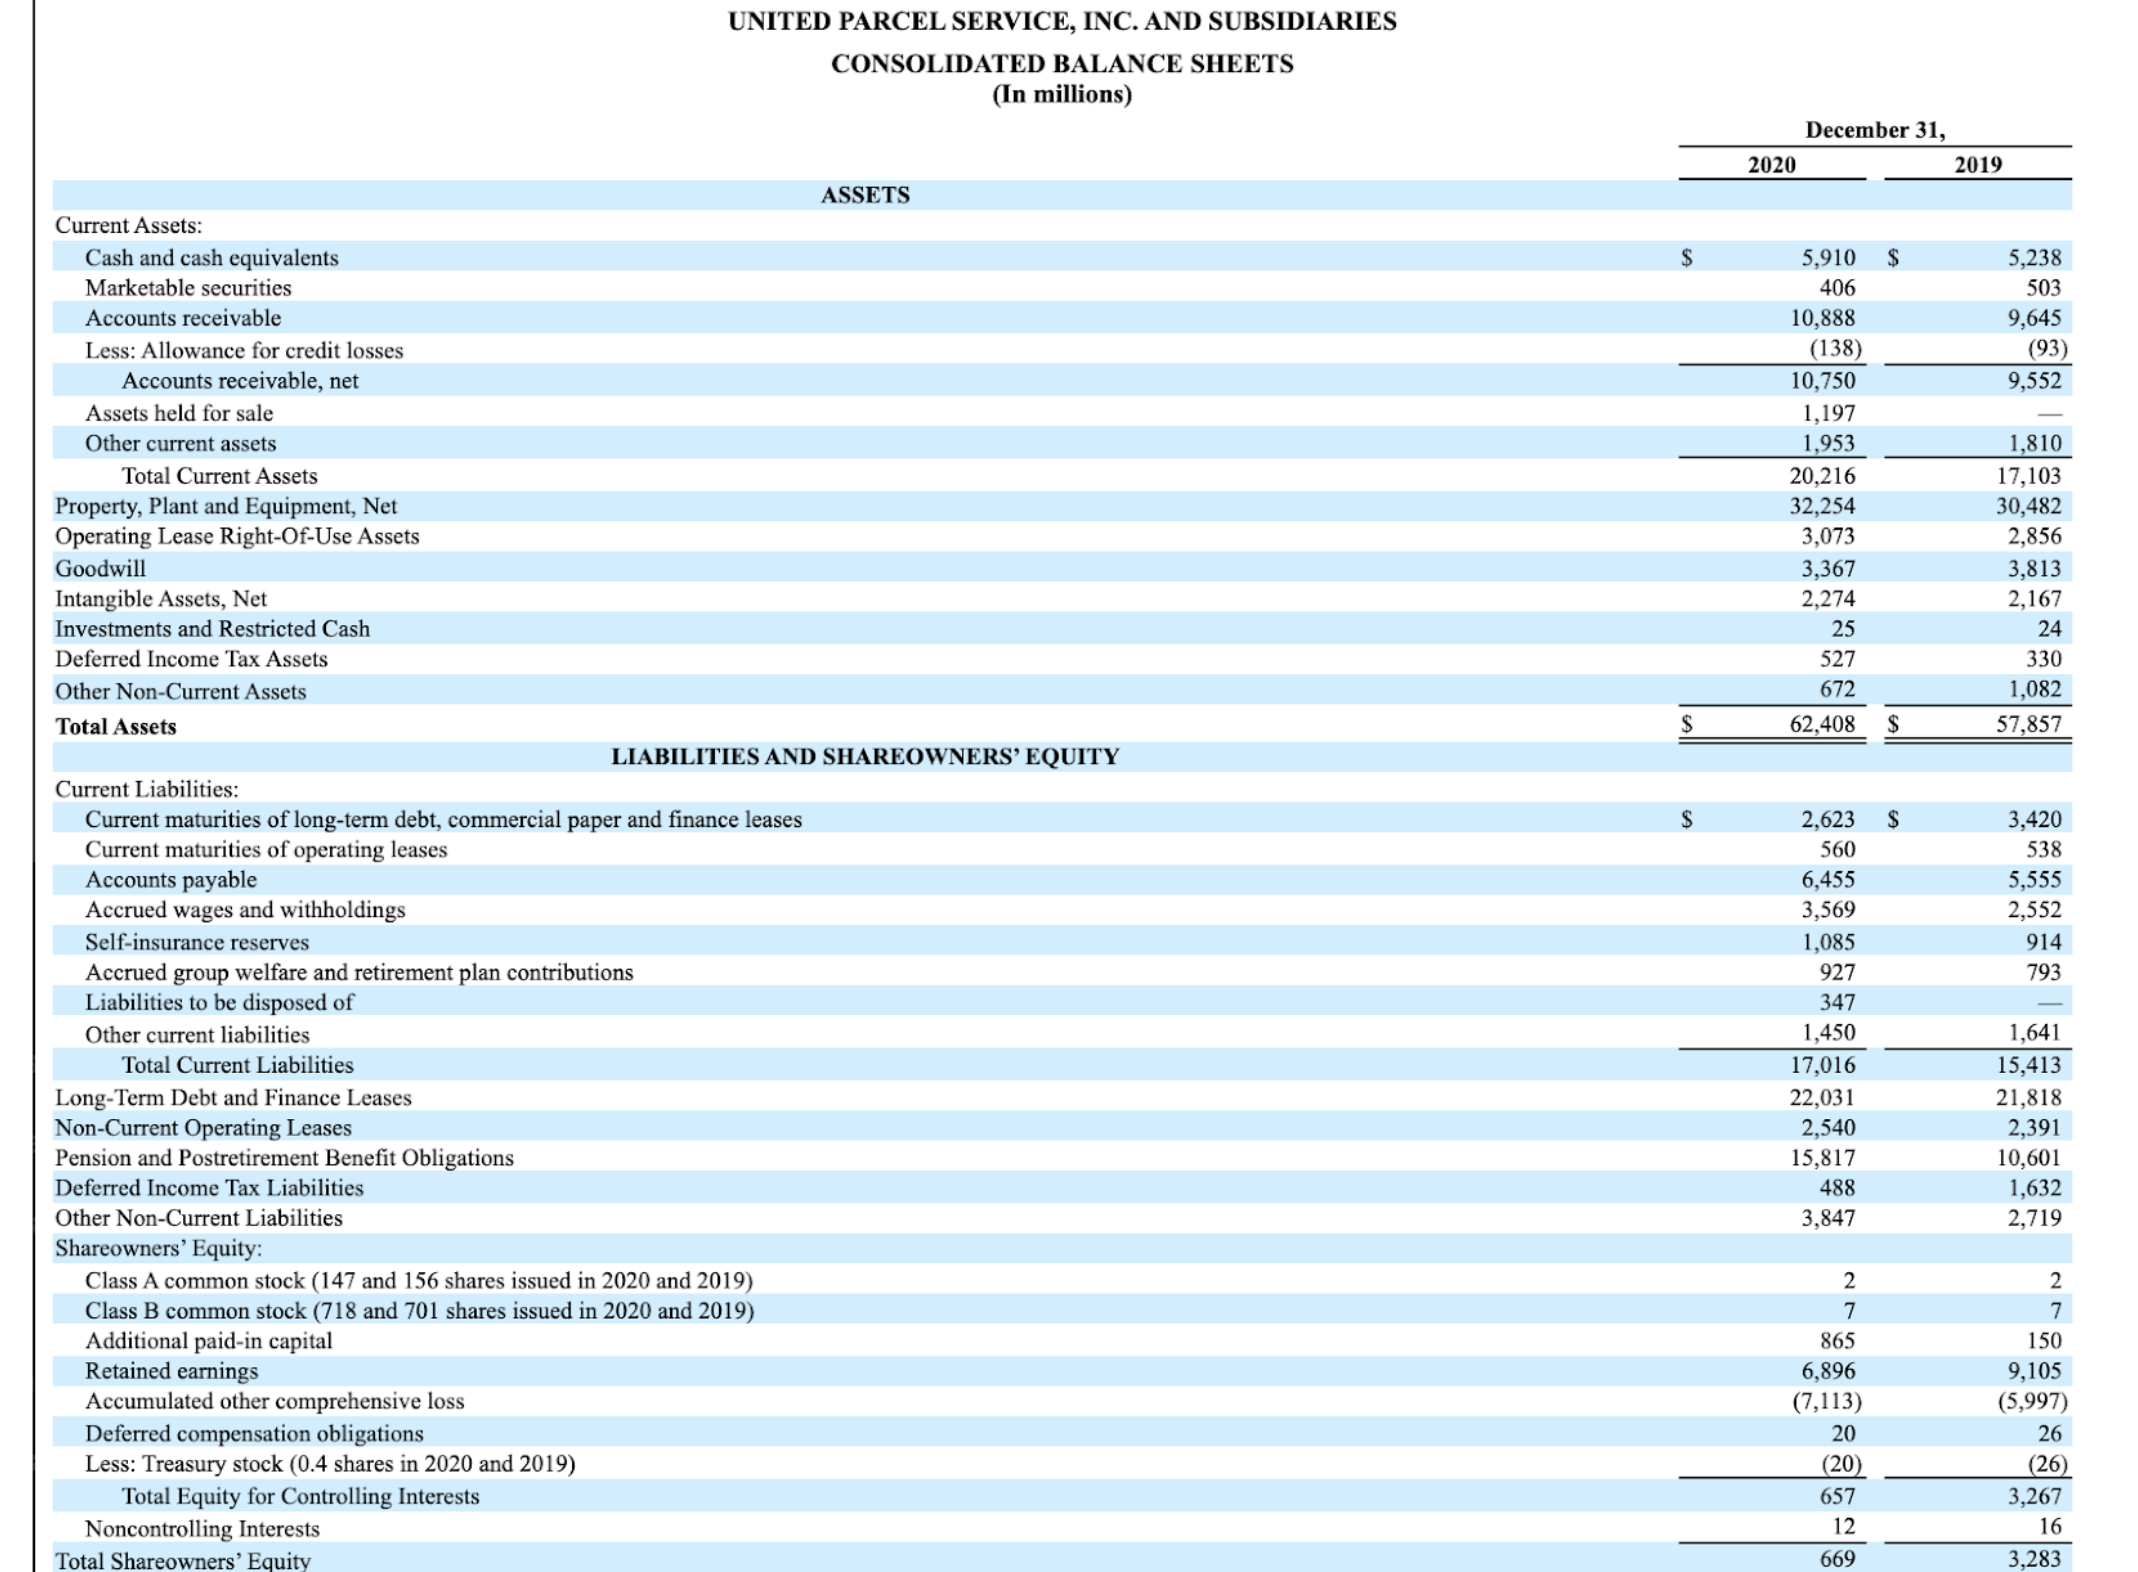
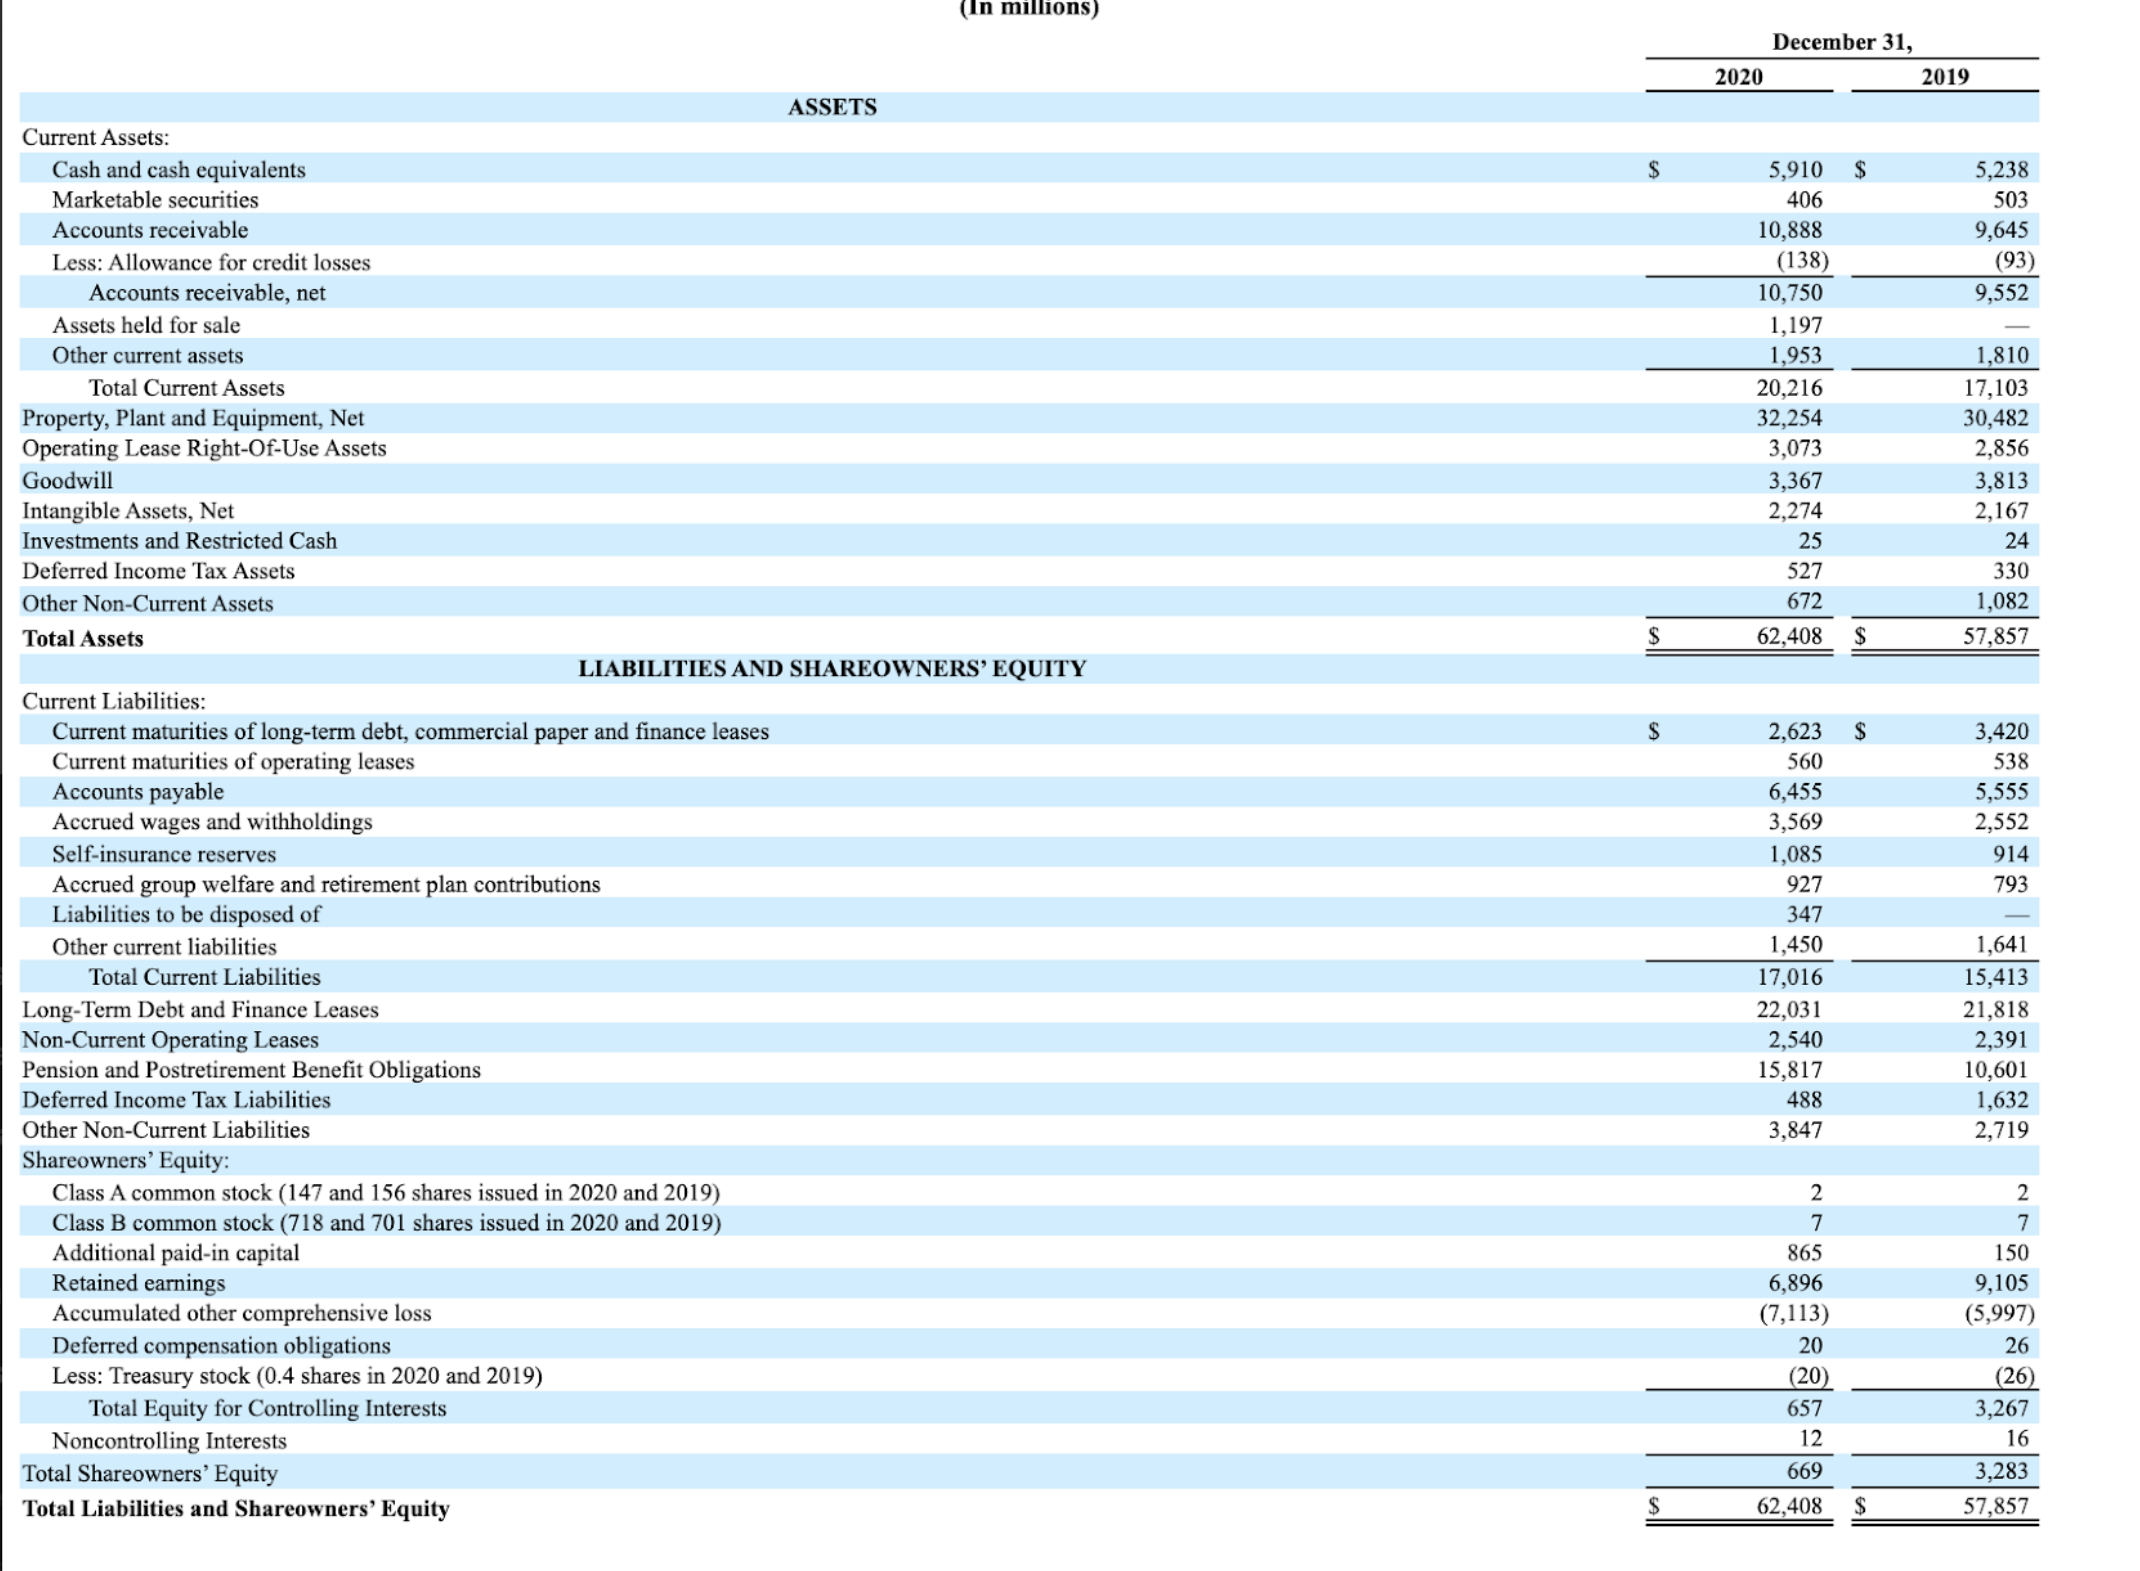
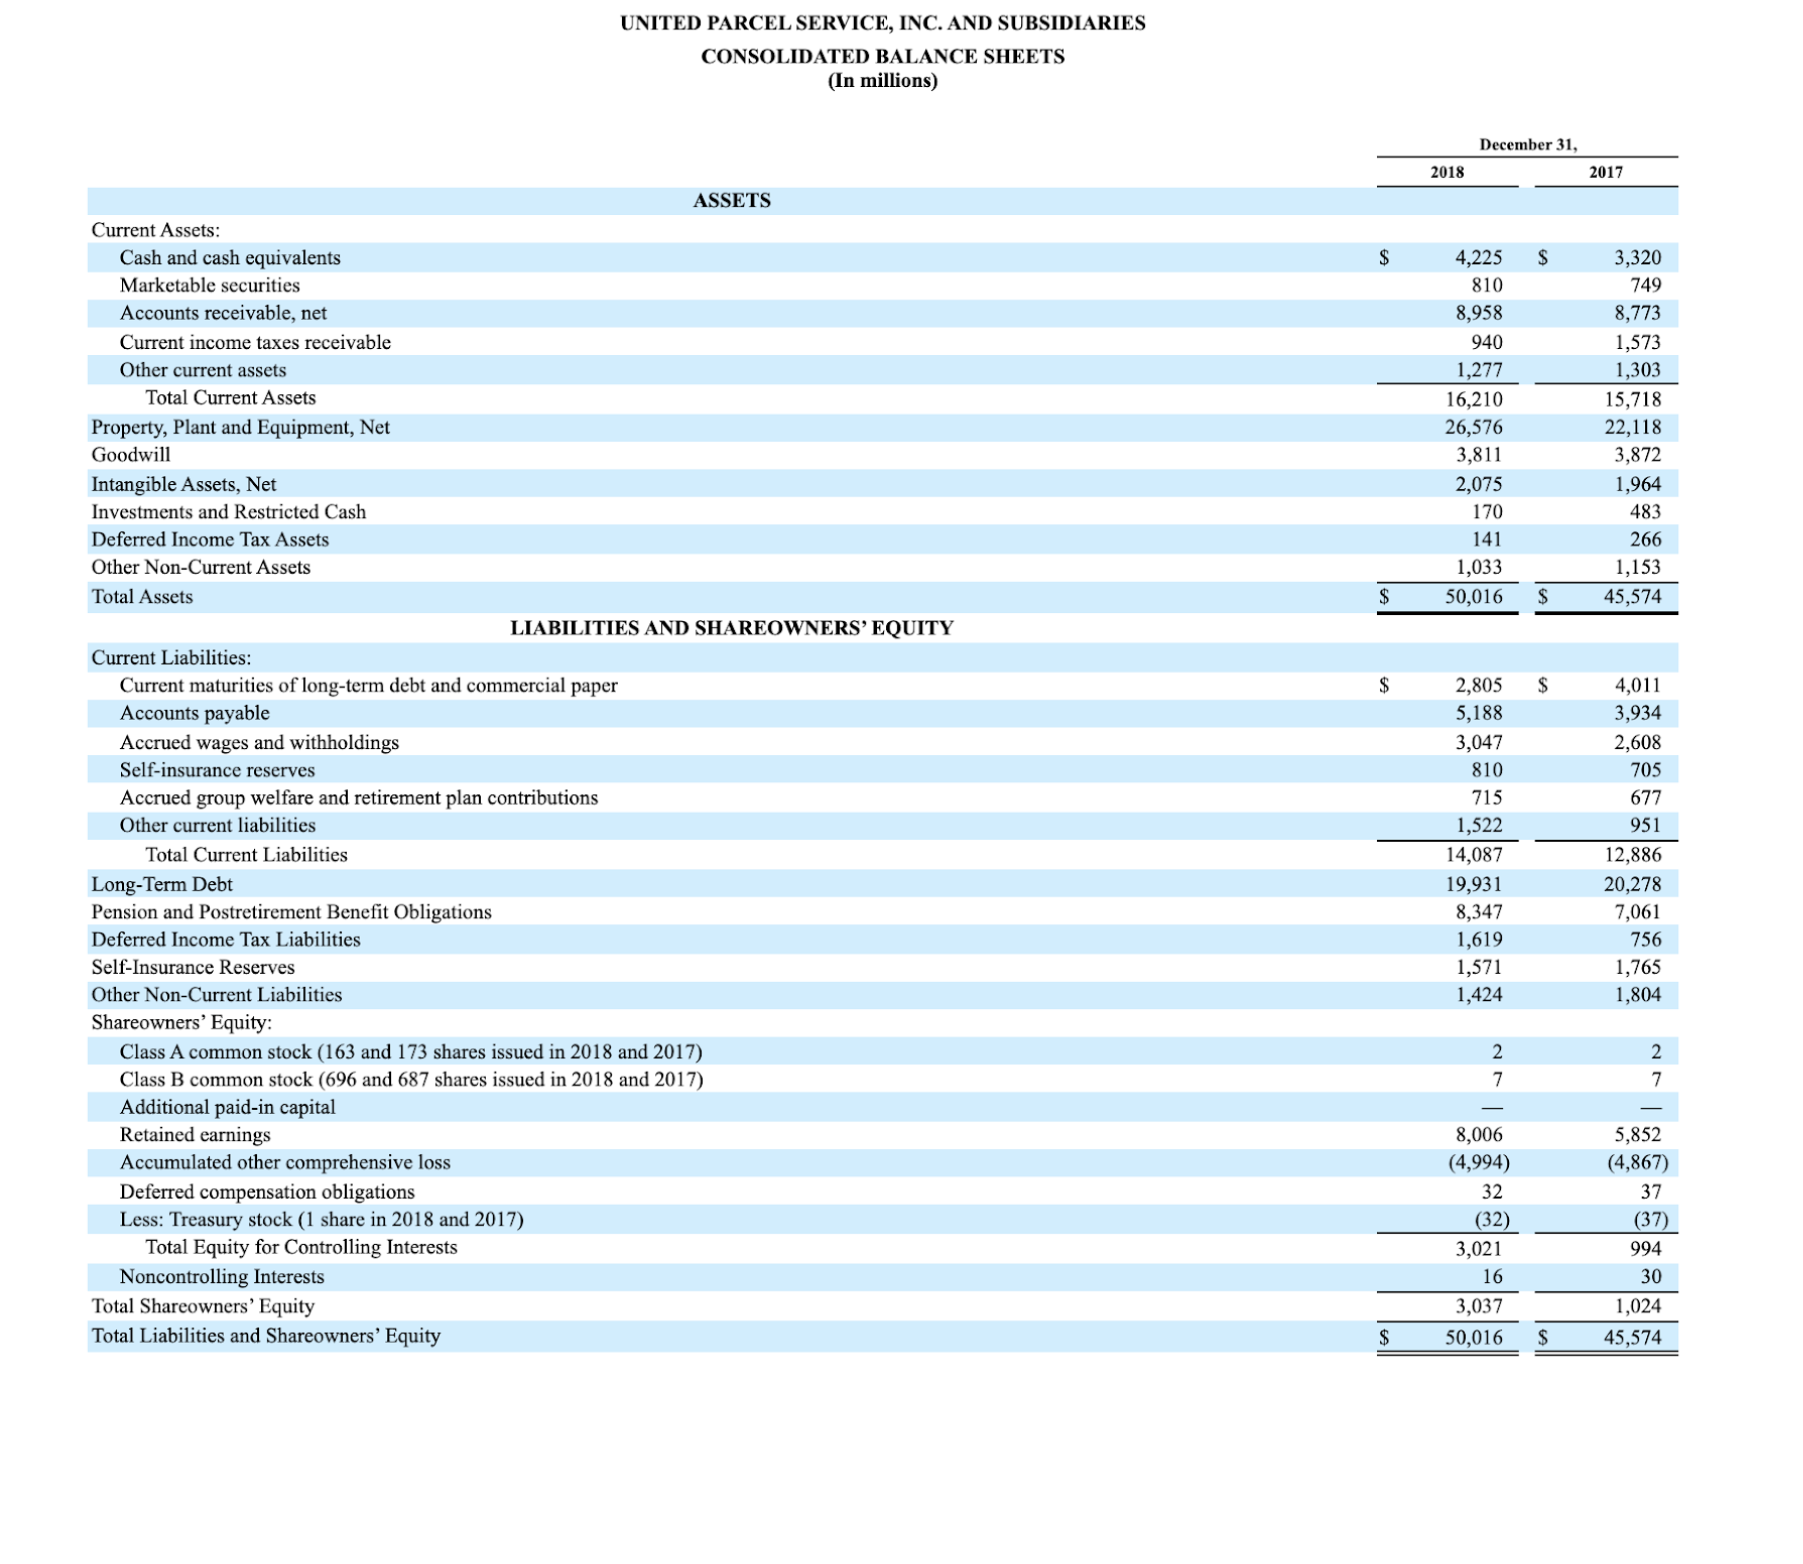
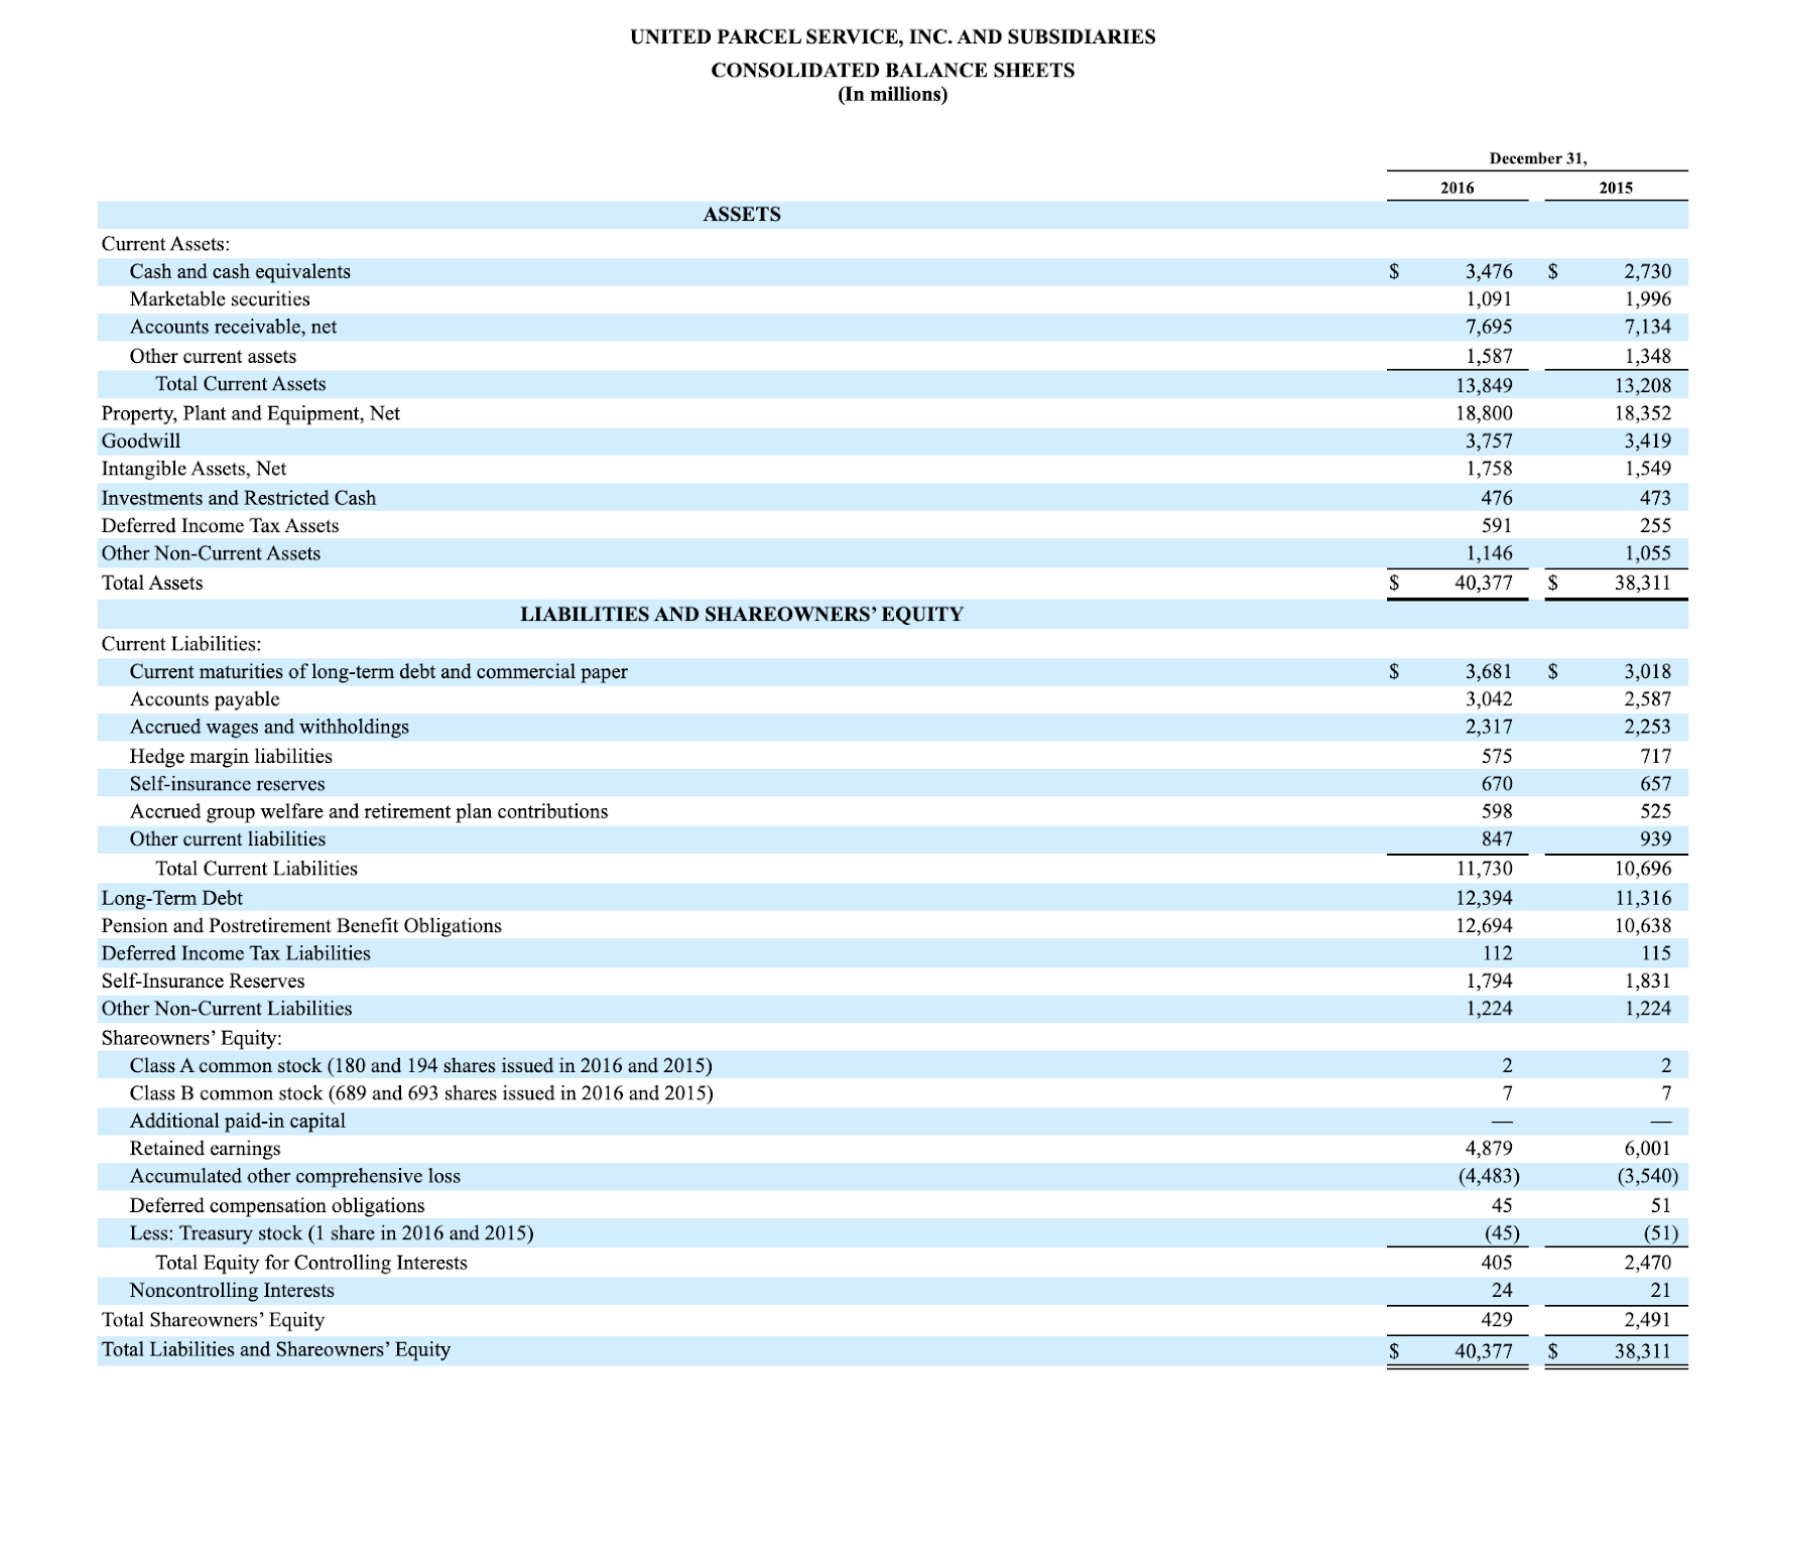
1. What is the Return on Assets (ROA) over the 5 years of data? Any trends? From 2020 until 2015.
2. What is the Return in Equity over the 5 years of data? Any trends? from 2020 until 2015.
3. What would you suggest to improve if needed to improve the trend Return on Assets?
4. What would you suggest to improve if needed to improve the trend Return in Equity?
Please show calculations and if can provide a graph to understand more.
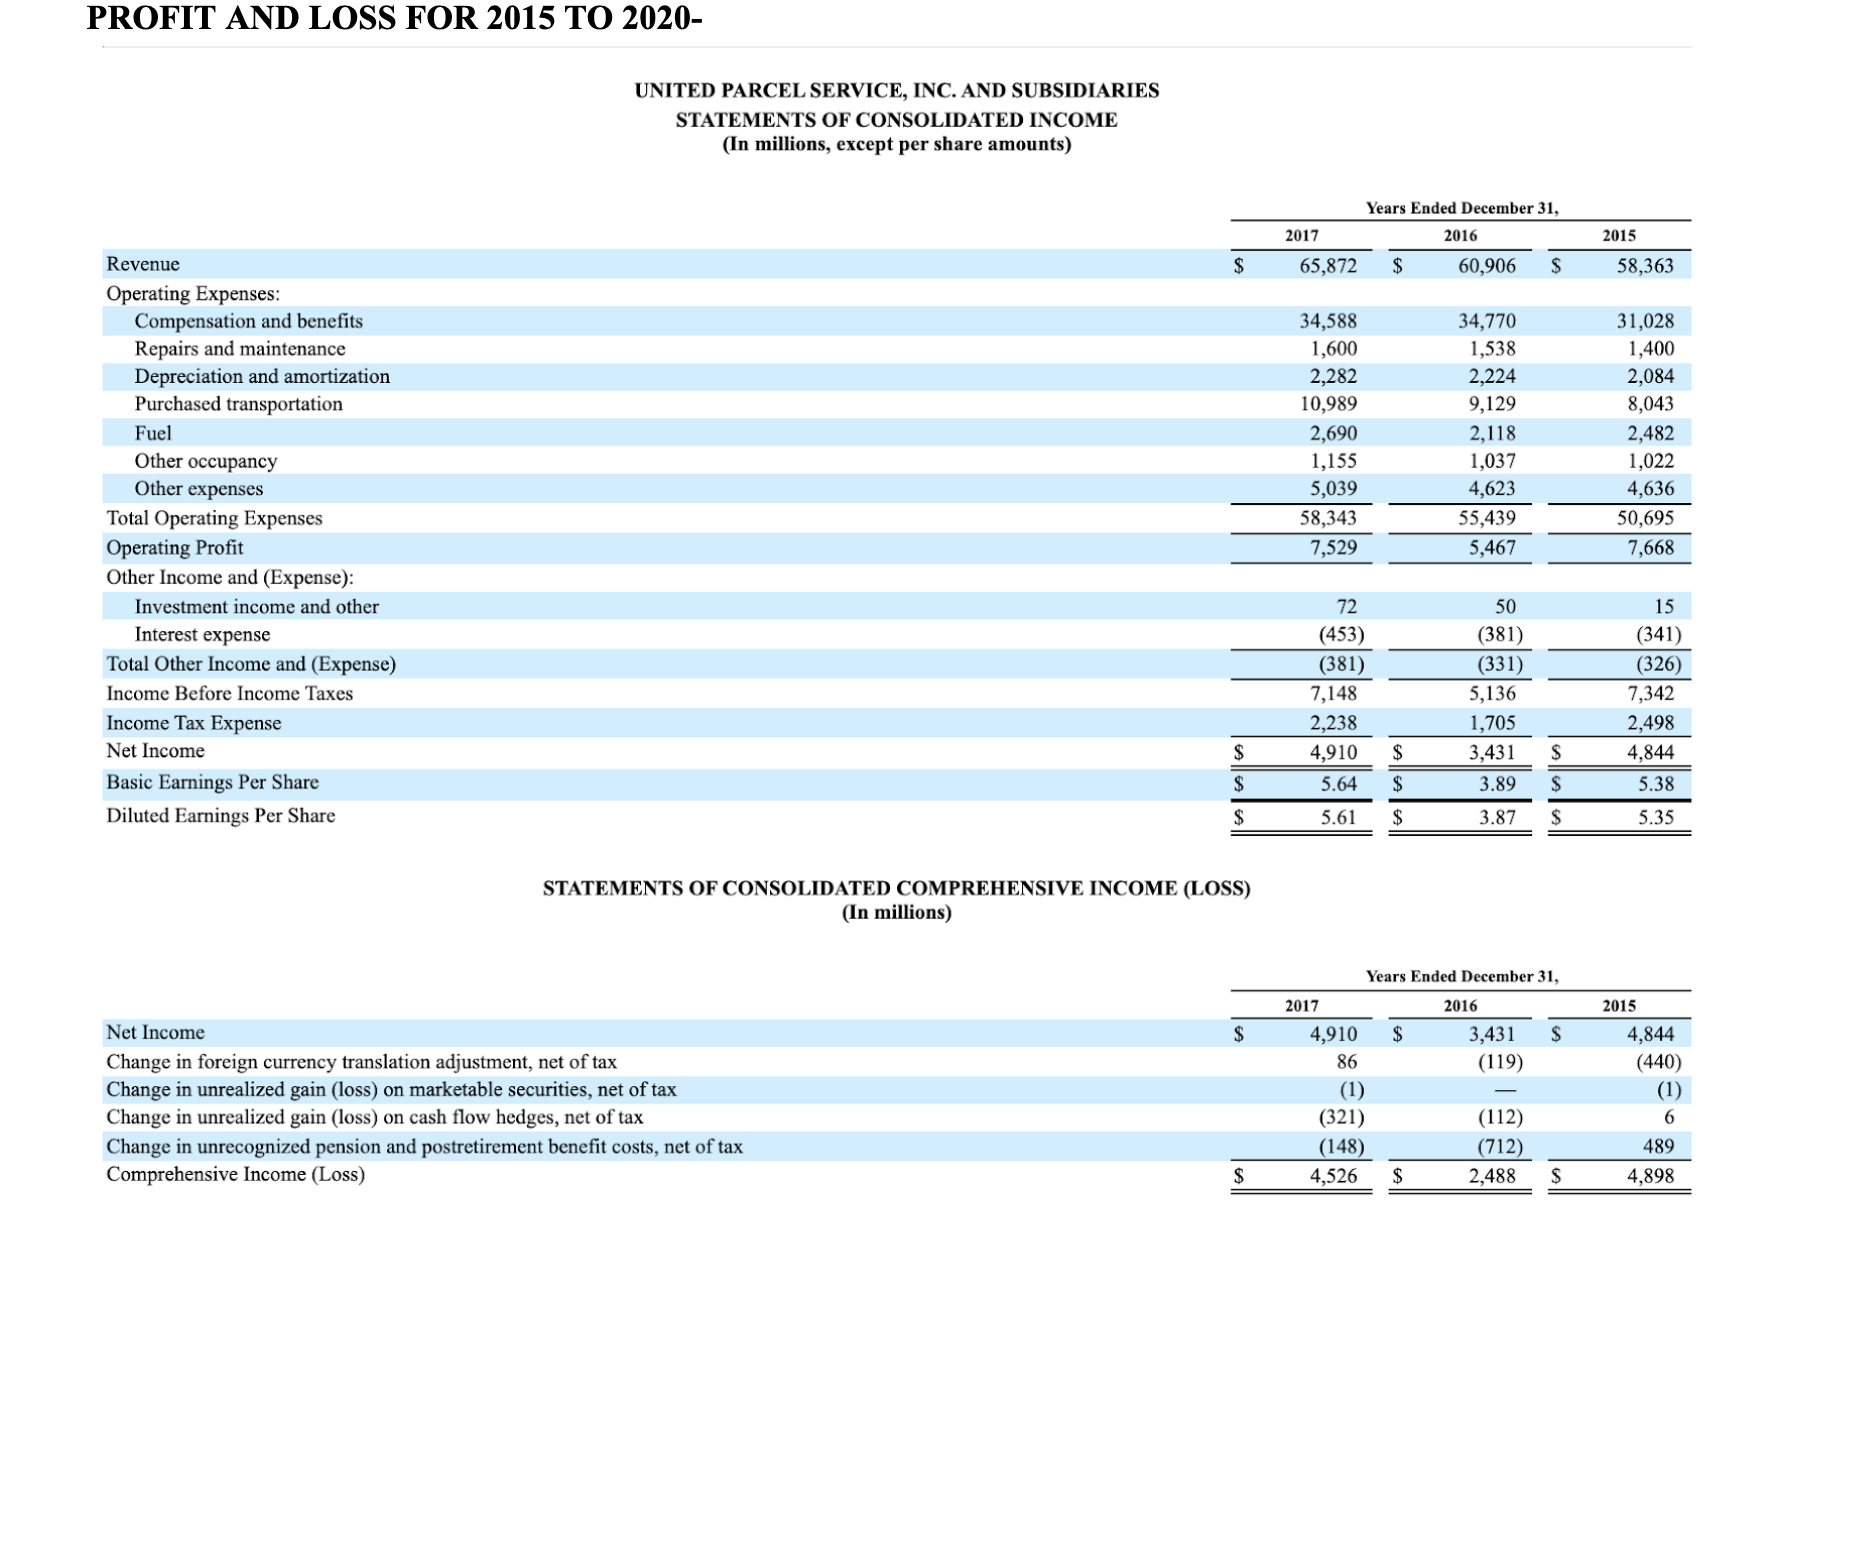
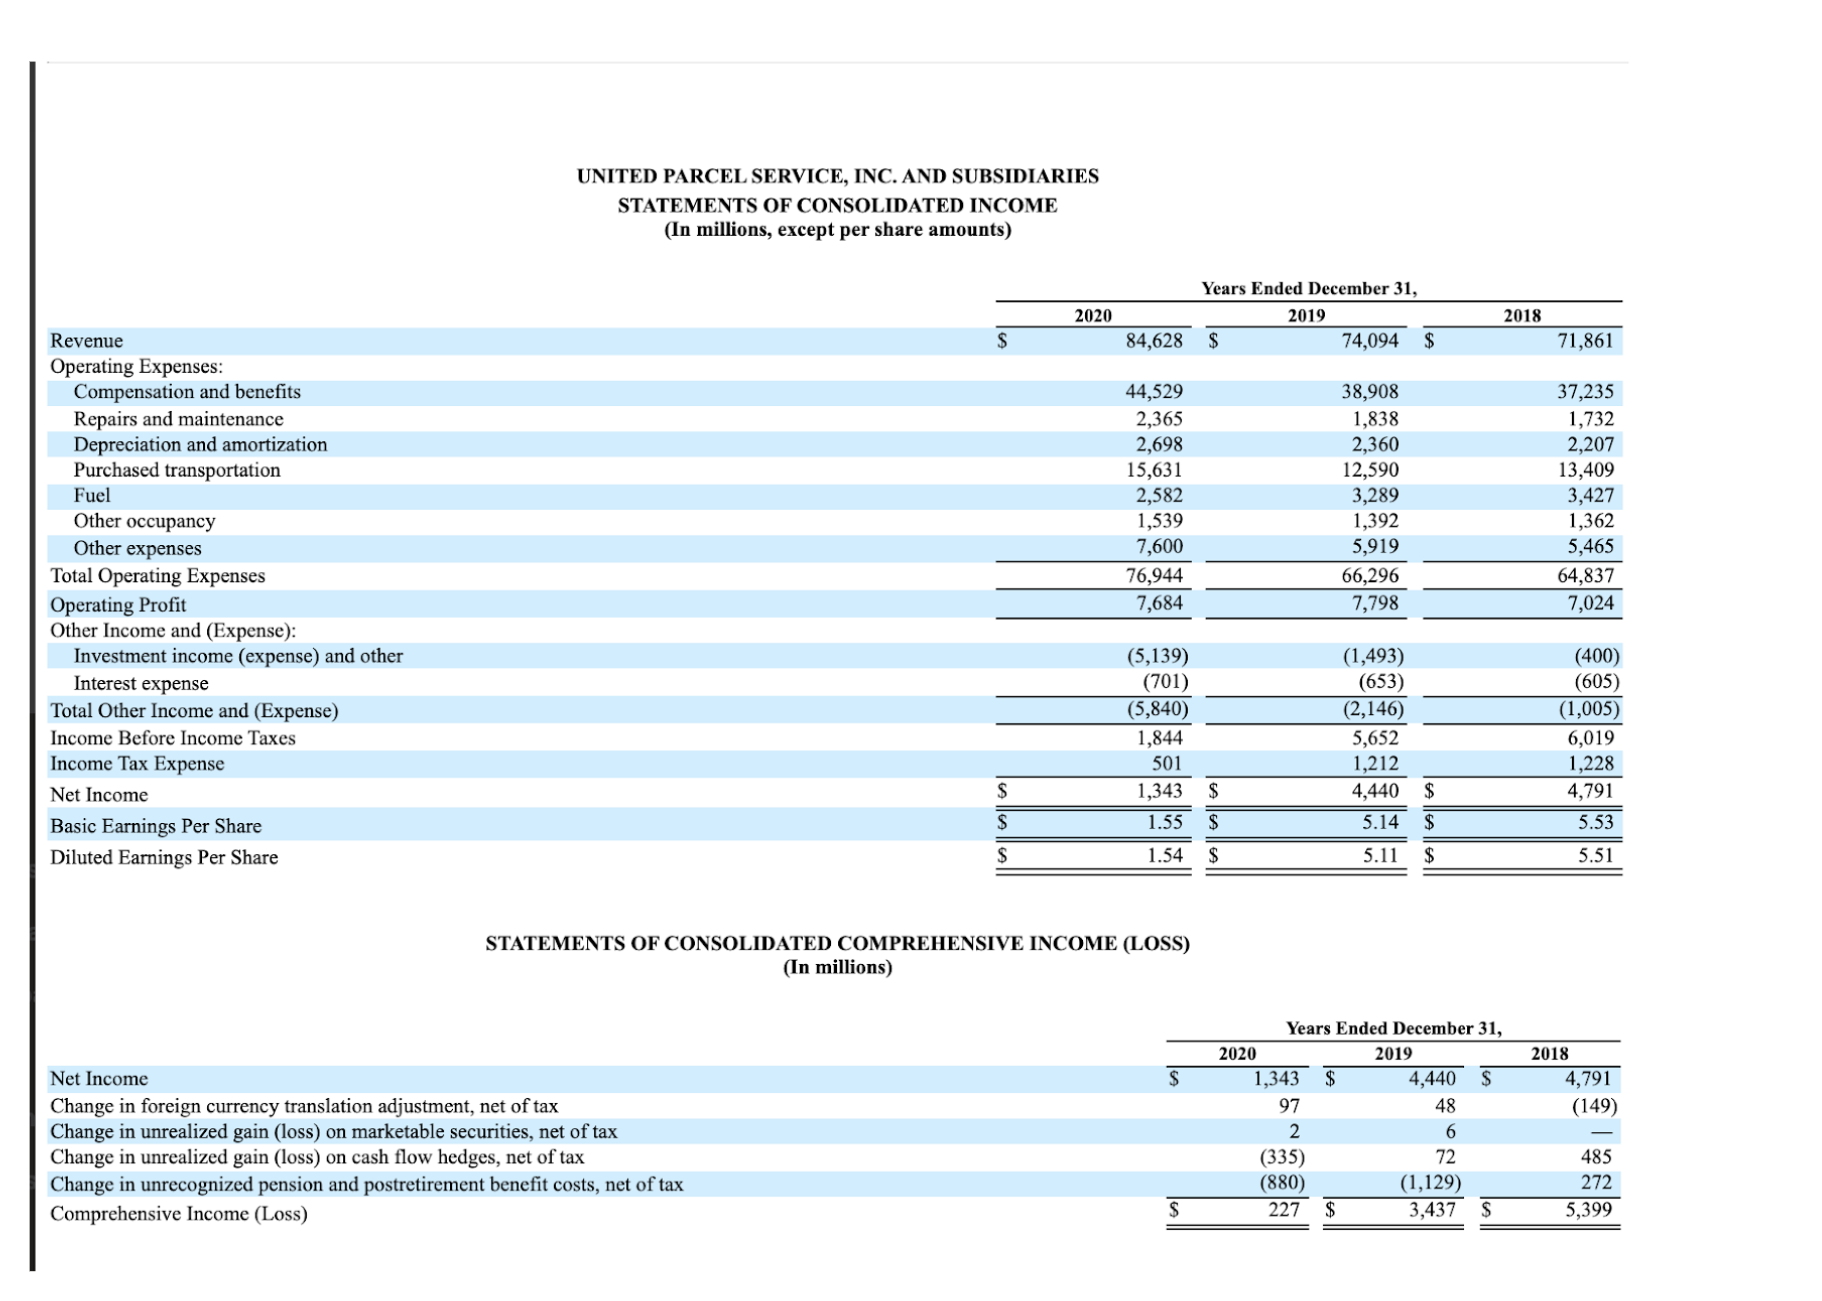
UNITED PARCEL SERVICE, INC. AND SUBSIDIARIES CONSOLIDATED BALANCE SHEETS (In millions) December 31, 2020 2019 ASSETS Current Assets: Cash and cash equivalents S 5,910 $ 5.238 Marketable securities 406 503 Accounts receivable 10,888 9,645 Less: Allowance for credit losses (138) (93) Accounts receivable, net 10,750 9,552 Assets held for sale 1, 197 Other current assets 1,953 1,810 Total Current Assets 20,216 17,103 Property, Plant and Equipment, Net 32,254 30,482 Operating Lease Right-Of-Use Assets 3,073 2,856 Goodwill 3,367 3,813 Intangible Assets, Net 2,274 2,167 Investments and Restricted Cash 25 24 Deferred Income Tax Assets 527 330 Other Non-Current Assets 672 1,082 Total Assets $ $2,408 $7,857 LIABILITIES AND SHAREOWNERS' EQUITY Current Liabilities: Current maturities of long-term debt, commercial paper and finance leases S 2.623 3.420 Current maturities of operating leases 560 538 Accounts payable 6,455 5,555 Accrued wages and withholdings 3,569 2,552 Self-insurance reserves 1.085 914 Accrued group welfare and retirement plan contributions 927 793 Liabilities to be disposed of 347 Other current liabilities 1,450 1.641 Total Current Liabilities 17,016 15,413 Long-Term Debt and Finance Leases 22.031 21,818 Non-Current Operating Leases 2,540 2,391 Pension and Postretirement Benefit Obligations 15,817 10,601 Deferred Income Tax Liabilities 488 1,632 Other Non-Current Liabilities 3,847 2,719 Shareowners' Equity: Class A common stock (147 and 156 shares issued in 2020 and 2019) 2 2 Class B common stock (718 and 701 shares issued in 2020 and 2019) 7 Additional paid-in capital 865 150 Retained earnings 5,896 9,105 Accumulated other comprehensive loss (7,113) (5,997) Deferred compensation obligations 20 26 Less: Treasury stock (0.4 shares in 2020 and 2019) (20) (26) Total Equity for Controlling Interests 657 3,267 Noncontrolling Interests 12 16 otal Sha 669 3,283Current Assets: Cash and call! equivalents Marketahle securities Accounts receivable Less: Allowance for credit losses Accounts receivable, net Assets held for sale Other current assets Total Current Assets Property, Plant and Equipment, Net Operating Lease RightOf-Use Assets Goodwill intangible Asses, Net Investments and Restricted Cash Deferred Income Tax Assets Other NonCurrent Assets Total Assets Current Liabilities: (in millions) ASSETS LIABILITIES AND SHAREOWNERS' EQUITY Current mean-ides of long-term debt, commercial paper and nance leases Current maturities of operating lenses Accounts payable Accrued wages and withholding Self-insurance reserves Accrued group welfare and retirement plan contributions Liabilities to be disposed of Other current liabilities Total Current Liabilities Long-Term Debt and Finance Leases Non-(hm Operating Leases Pension and Postretirernent Benet Obligations Deferred Income Tax Liabilities Other Non-Current Liabilities Shueowners' Equity: Class A common stock (147 and 156 shares issued in 2020 and 2019) Class B common stock (718 and 701 shares issued in2020 and 2019) Additional paid-in capital Retained earnings Accumulated other comprehensive loss Deferred compensation obligations Less: Treasury stock (0.4 shares in 2020 and 2019) Total Equity for Controlling interests Noncontrolling Interests Total Shareowners' Equity Tutsi Liabilities Ind Shoreowners' Equity December 31, 2020 2019 3 5,910 3 5,238 406 503 10,888 9,645 ( 1 38) (93) 10,750 9,552 l , 197 1,953 1,810 20,216 17,103 32,254 30,482 3,073 2,856 3,367 3,813 2,274 2, 1 67 25 24 527 330 672 1,082 5 62,408 S 57,857 5 2,623 S 3.420 560 538 6,455 5,555 3,569 2,552 1,085 914 927 793 347 I .450 1 ,641 17,016 15,413 22,031 21,818 2,540 2,391 15,817 10,601 488 1,632 3,847 2,719 2 Z 7 7 865 1 50 6,896 9,105 (7,113) (5,997) 20 26 20) 26) 657 3.267 12 16 669 3,283 5 62,408 S 57,857 Current Assets: Cash and call! equivalents Marketahle securities Accounts receivable Less: Allowance for credit losses Accounts receivable, net Assets held for sale Other current assets Total Current Assets Property, Plant and Equipment, Net Operating Lease RightOf-Use Assets Goodwill intangible Asses, Net Investments and Restricted Cash Deferred Income Tax Assets Other NonCurrent Assets Total Assets Current Liabilities: (in millions) ASSETS LIABILITIES AND SHAREOWNERS' EQUITY Current mean-ides of long-term debt, commercial paper and nance leases Current maturities of operating lenses Accounts payable Accrued wages and withholding Self-insurance reserves Accrued group welfare and retirement plan contributions Liabilities to be disposed of Other current liabilities Total Current Liabilities Long-Term Debt and Finance Leases Non-(hm Operating Leases Pension and Postretirernent Benet Obligations Deferred Income Tax Liabilities Other Non-Current Liabilities Shueowners' Equity: Class A common stock (147 and 156 shares issued in 2020 and 2019) Class B common stock (718 and 701 shares issued in2020 and 2019) Additional paid-in capital Retained earnings Accumulated other comprehensive loss Deferred compensation obligations Less: Treasury stock (0.4 shares in 2020 and 2019) Total Equity for Controlling interests Noncontrolling Interests Total Shareowners' Equity Tutsi Liabilities Ind Shoreowners' Equity December 31, 2020 2019 3 5,910 3 5,238 406 503 10,888 9,645 ( 1 38) (93) 10,750 9,552 l , 197 1,953 1,810 20,216 17,103 32,254 30,482 3,073 2,856 3,367 3,813 2,274 2, 1 67 25 24 527 330 672 1,082 5 62,408 S 57,857 5 2,623 S 3.420 560 538 6,455 5,555 3,569 2,552 1,085 914 927 793 347 I .450 1 ,641 17,016 15,413 22,031 21,818 2,540 2,391 15,817 10,601 488 1,632 3,847 2,719 2 Z 7 7 865 1 50 6,896 9,105 (7,113) (5,997) 20 26 20) 26) 657 3.267 12 16 669 3,283 5 62,408 S 57,857 UNITED PARCEL SERVICE, INC. AND SUBSIDIARIES CONSOLIDATED BALANCE SHEETS (In millions) December 31, 2018 2017 ASSETS Current Assets: Cash and cash equivalents 4,225 3,320 Marketable securities 810 749 Accounts receivable, net 8,958 8,773 Current income taxes receivable 940 1.573 Other current assets 1,277 1,303 Total Current Assets 16,210 15,718 Property, Plant and Equipment, Net 26,576 22,118 Goodwill 3,811 3,872 Intangible Assets, Net 2,075 1,964 Investments and Restricted Cash 170 483 Deferred Income Tax Assets 141 266 Other Non-Current Assets 1,033 1,153 Total Assets $ 50,016 45,574 LIABILITIES AND SHAREOWNERS' EQUITY Current Liabilities: Current maturities of long-term debt and commercial paper $ 2,805 4,011 Accounts payable 5,188 3,934 Accrued wages and withholdings 3,047 2,608 Self-insurance reserves 810 705 Accrued group welfare and retirement plan contributions 715 677 Other current liabilities 1,522 951 Total Current Liabilities 14,087 12,886 Long-Term Debt 19,93 20,278 Pension and Postretirement Benefit Obligations 8,347 7,061 Deferred Income Tax Liabilities 1,619 756 Self-Insurance Reserves 1,571 1,765 Other Non-Current Liabilities 1,424 1,804 Shareowners' Equity: Class A common stock (163 and 173 shares issued in 2018 and 2017) J N 2 Class B common stock (696 and 687 shares issued in 2018 and 2017) 7 Additional paid-in capital Retained earnings 8,006 5,852 Accumulated other comprehensive loss (4,994) (4,867) Deferred compensation obligations 32 37 Less: Treasury stock (1 share in 2018 and 2017) (32) (37) Total Equity for Controlling Interests 3,021 994 Noncontrolling Interests 16 30 Total Shareowners' Equity 3,037 1,024 Total Liabilities and Shareowners' Equity 50,016 45,574UNITED PARCEL SERVICE, INC. AND SUBSIDIARIES CONSOLIDATED BALANCE SHEETS (In millions) December 31, 2016 2015 ASSETS Current Assets: Cash and cash equivalents $ 3,476 $ 2,730 Marketable securities 1,091 1,996 Accounts receivable, net 7,695 7.134 Other current assets 1,587 1,348 Total Current Assets 13,849 13,208 Property, Plant and Equipment, Net 18,800 18,352 Goodwill 3, 757 3.419 Intangible Assets, Net 1,758 1,549 Investments and Restricted Cash 476 473 Deferred Income Tax Assets 591 255 Other Non-Current Assets 1,146 1,055 Total Assets 40,377 38,311 LIABILITIES AND SHAREOWNERS' EQUITY Current Liabilities: Current maturities of long-term debt and commercial paper 3,681 3,018 Accounts payable 3,042 2.587 Accrued wages and withholdings 2,317 2,253 Hedge margin liabilities 575 717 Self-insurance reserves 670 657 Accrued group welfare and retirement plan contributions 598 525 Other current liabilities 847 939 Total Current Liabilities 11,730 10,696 Long-Term Debt 12,394 11,316 Pension and Postretirement Benefit Obligations 12,694 10,638 Deferred Income Tax Liabilities 112 115 Self-Insurance Reserves 1,794 1,831 Other Non-Current Liabilities 1,224 1,224 Shareowners' Equity: Class A common stock (180 and 194 shares issued in 2016 and 2015) 2 Class B common stock (689 and 693 shares issued in 2016 and 2015) 7 Additional paid-in capital Retained earnings 4,879 6,001 Accumulated other comprehensive loss (4,483) (3,540) Deferred compensation obligations 45 51 Less: Treasury stock (1 share in 2016 and 2015) (45) (51) Total Equity for Controlling Interests 405 2,470 Noncontrolling Interests 24 21 Total Shareowners' Equity 429 2,491 Total Liabilities and Shareowners' Equity $ 40,377 38,311PROFIT AND LOSS FOR 2015 TO 2020- UNITED PARCEL SERVICE, INC. AND SUBSIDIARIES STATEMENTS OF CONSOLIDATED INCOME (In millions, except per share amounts) Years Ended December 31, 2017 2016 2015 Revenue 65,872 60,906 58,363 Operating Expenses Compensation and benefits 34,588 34,770 31,028 Repairs and maintenance 1,600 1,538 1,400 Depreciation and amortization 2,282 2,224 2,084 Purchased transportation 10,989 9.129 8.043 Fuel 2,690 2,118 2,482 Other occupancy 1,155 1,037 1.022 Other expenses ,039 4,623 4,636 Total Operating Expenses 58,343 55,439 50,695 Operating Profit 7,529 5,467 7,668 Other Income and (Expense): Investment income and other 72 50 15 Interest expense (453) (381) 341) Total Other Income and (Expense) (381) (331) (326) Income Before Income Taxes 7,148 5,136 7,342 Income Tax Expense 2,238 1,705 2,498 Net Income ,910 $ ,431 $ 4,844 Basic Earnings Per Share 5.64 3.89 5.38 Diluted Earnings Per Share 5.61 3.87 5.35 STATEMENTS OF CONSOLIDATED COMPREHENSIVE INCOME (LOSS) (In millions) Years Ended December 31, 2017 2016 2015 Net Income 4,910 $ 3.431 4.844 Change in foreign currency translation adjustment, net of tax 86 (119) (440 Change in unrealized gain (loss) on marketable securities, net of tax (1) (1) Change in unrealized gain (loss) on cash flow hedges, net of tax (321) (112) Change in unrecognized pension and postretirement benefit costs, net of tax (148) (712) 489 Comprehensive Income (Loss 4,526 2,488 4,898Revenue Operating Expenses: Compensation and benets Repairs and maintenance Depreciation and amortization Purchased transportation Fuel Other occupancy Other expenses Total Operating Expenses Operating Prot Other Income and (Expense): Investment income (expense) and other Interest expense Total Other Income and (Expense) Income Before Income Taxes Income Tax Expense Net Income Basic Earnings Per Share Diluted Earnings Per Share Net Income Change in foreign currency translation adjustment, net of tax UNITED PARCEL SERVICE, INC. AND SUBSIDIARIES STATEMENTS OF CONSOLIDATED INCOME (In millions, except per share amounts) Change in unrealized gain (loss) on marketable securities, net oftax Change in unrealized gain (loss) on cash ow hedges, net of tax Change in unrecognized pension and pometirement benet costs. net of tax Comprehensive Income (loss) Yean Ended December 31, 2020 2019 2018 3 04,628 3 74.094 3 71,861 44,529 38,908 37,235 2,365 1,838 1,732 2,698 2,360 2,207 15,631 12,590 13,409 2,582 3,289 3,427 1,539 1,392 1,362 7,600 5,919 5,465 76,944 66,296 64,837 7,684 7,798 7,024 (5,139) (1,493) (400) (701) (653) (605) (5.840) (2,146) (1.005) 1,844 5,652 6,019 501 1,212 1,228 $ 1,343 $ 4,440 5 4,791 $ 1.55 3 5114 S 5.53 $ 1.54 3 5.11 $ 5.51 STATEMENTS OF CONSOLIDATED COMPREHENSIVE INCOME (LOSS) (In millions) Year: Ended December 31, 2020 1019 2011! 8 1,343 $ 4,440 5 4,791 97 48 (149) 2 6 (335) 72 485 (880) (1,129) 272 5 227 $ 3,437 $ 5,399
Step by Step Solution
There are 3 Steps involved in it
1 Expert Approved Answer
Step: 1 Unlock
Question Has Been Solved by an Expert!
Get step-by-step solutions from verified subject matter experts
Step: 2 Unlock
Step: 3 Unlock
Students Have Also Explored These Related Accounting Questions!