

Question: 1) What is the test statistic? 2) What is the p value of the test? 3) Using a significance level of 0.05, should the authors
1) What is the test statistic? 2) What is the p value of the test? 3) Using a significance level of 0.05, should the authors reject the null hypothesis? Why? Interpret the p value in the answer.
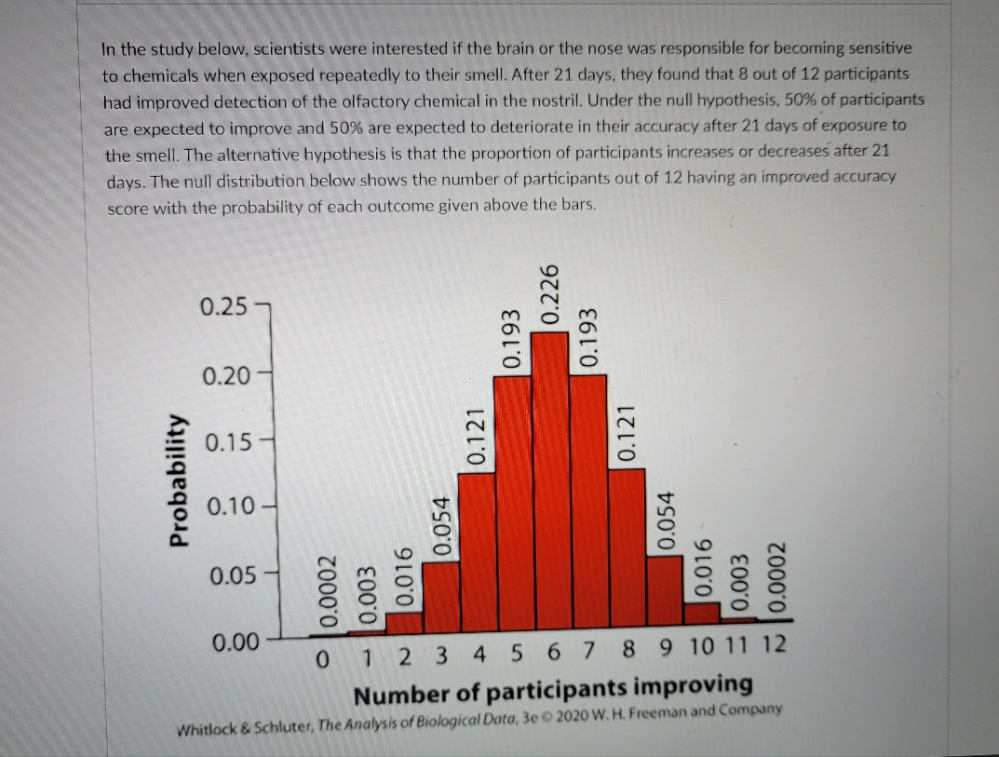
In the study below, scientists were interested if the brain or the nose was responsible for becoming sensitive to chemicals when exposed repeatedly to their smell. After 21 days, they found that 8 out of 12 participants had improved detection of the olfactory chemical in the nostril. Under the null hypothesis, 50% of participants are expected to improve and 50% are expected to deteriorate in their accuracy after 21 days of exposure to the smell. The alternative hypothesis is that the proportion of participants increases or decreases after 21 days. The null distribution below shows the number of participants out of 12 having an improved accuracy score with the probability of each outcome given above the bars. 0.226 0.25 0.193 0.193 0.20 0.15 0.121 0.121 Probability 0.10 0.054 0.054 0.05 0.016 0.016 0.003 |0.0002 0.0002 0.003 0.00 0 1 2 3 4 5 6 7 8 9 10 11 12 Number of participants improving Whitlock & Schluter, The Analysis of Biological Data, 3e . 2020 W. H. Freeman and Company
Step by Step Solution
There are 3 Steps involved in it

Get step-by-step solutions from verified subject matter experts