

Question: 1. what is the upper limit ? 2. what is the center line ? 3. what is the lower limit ? A quality inspector took
1. what is the upper limit ?
2. what is the center line ?
3. what is the lower limit ?
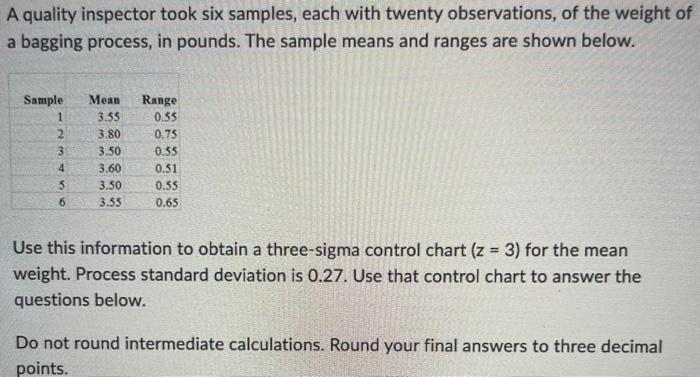
A quality inspector took six samples, each with twenty observations, of the weight of a bagging process, in pounds. The sample means and ranges are shown below. Use this information to obtain a three-sigma control chart (z=3) for the mean weight. Process standard deviation is 0.27 . Use that control chart to answer the questions below. Do not round intermediate calculations. Round your final answers to three decimal points
Step by Step Solution
There are 3 Steps involved in it
1 Expert Approved Answer
Step: 1 Unlock

Question Has Been Solved by an Expert!
Get step-by-step solutions from verified subject matter experts
Step: 2 Unlock
Step: 3 Unlock