

Question: 1. Why do goaly have bo be set beluec a whole-farm plan caw be deculoger! budper? farm plass. infocmative 7. What values could you change
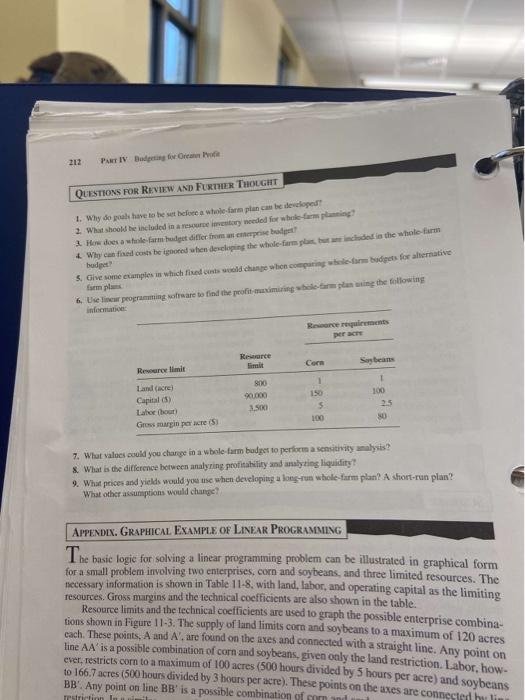
1. Why do goaly have bo be set beluec a whole-farm plan caw be deculoger! budper? farm plass. infocmative 7. What values could you change in a wbole farm bodger to perform a senitivity amalyis? 8. What is the difference between analyring profitatility and andyring liquidity? 9. What prices and yields woald yos use when developitg a longrus whele-farm plan? A short-run plan? What other assumptions would change? APPENDLX. GRAPHICAL EXAMPLE OF LINEAR PROGRAMMING The basic logic for solving a linear programming problem can be illustrated. in graphical form for a small problem involving two enterprises, corn and soybeans, and three limited resources. The necessary information is shown in Table 11.8, with land, lahor, and operating capital as the limiting: resources. Giross margins and the technical cocfficicnts are also shown in the table. Resoure limits and the technical cocfficients are used to graph the possible enterprise combinafions shown in Figure 11-3. The supply of hand limits corn and soybeans to a maximum of 120 acres each. These pownets, A and A, are focind on the axes and connected with a straight line. Any point on line AA is a possible combination of corn and soybeans, given only the land restriction. Labor, how. ever, restricts corn to a maximum of 100 acres ( 500 hours divided by 5 hours per acre) and soybeans to 166.7 acres ( 500 hours divided by 3 hours per acte). These points on the axes are connected hu liins. BB: Any point on line BB' is a possible combination of co
Step by Step Solution
There are 3 Steps involved in it

Get step-by-step solutions from verified subject matter experts