

Question: 1. Write down the sample regression model of the model (1) based on the result (1)? Write down the population regression model and sample regression
1. Write down the sample regression model of the model (1) based on the result (1)? Write down the population regression model and sample regression model for male and female employees and explain the meaning of the estimated regression coefficients?
2. Use results (2), (3), and (4) to test for possible problems in the estimated model of the model (1). In each test, specify clearly the type of test, type of problem, the statistic used, null and alternative hypothesis, and conclusion about the problem.
3. Using result (1), for male employees, how do the expenditures for beer change if their income increases 1000USD/year? Answer the same question for female employees given that:
cov(B2,B5)=0
4. In model (1), state the null and the alternative hypothesis if you want to test that the models for the expenditures of beer for males and females are not different in slope coefficients of both INC and AGE. In other words, you want to conduct the joint test of the hypothesis of equal slope coefficients of male and female for INC and equal slope coefficients of male and female for AGE. Perform this test using the appropriate information given above.
5. Using the results above to test the hypothesis that the variable SEX does not affect the annual expenditures for beer.
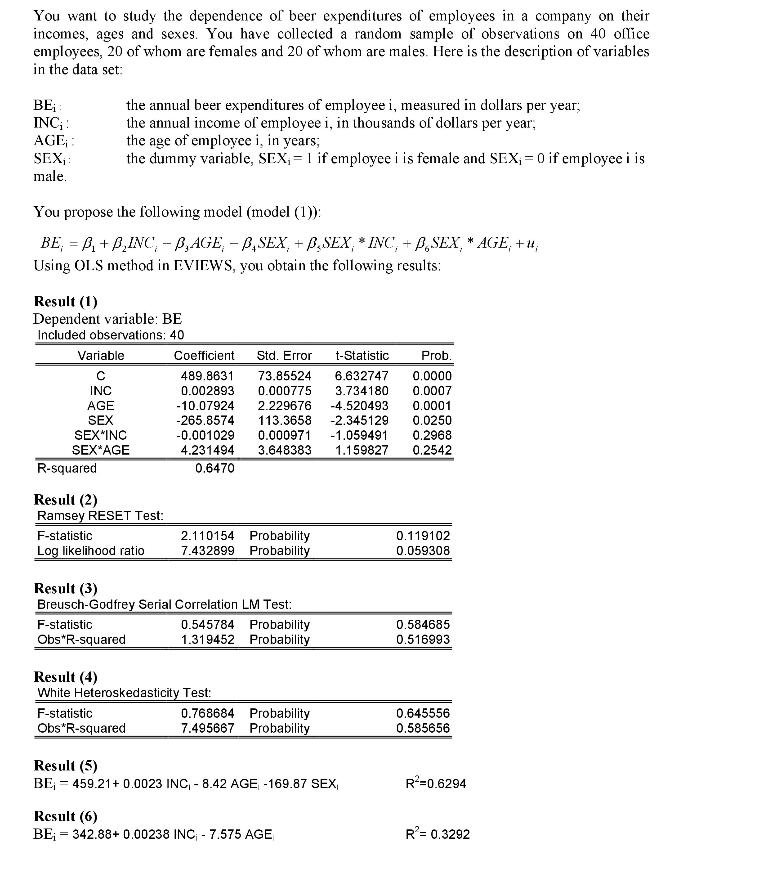
You want to study the dependence of beer expenditures of employees in a company on their incomes, ages and sexes. You have collected a random sample of observations on 40 oflice employees, 20 of whom are females and 20 of whom are males. Here is the description of variables in the data set: BE; : INC; : AGE : the annual beer expenditures of employee i, measured in dollars per year; the annual income of employee i, in thousands of dollars per year; the age of employee i, in years; the dummy variable, SEX,= 1 if employee i is female and SEX,=0 if employee i is SEX,: male. You propose the following model (model (1)): BE, = B, + B,INC, - B,AGE, - B,SEX, + B,SEX, * INC', = B,SEX, * AGE, +u, Using OLS method in EVIEWS, you obtain the following results: %3D Result (1) Dependent variable: BE Included observations: 40 Variable Coefficient Std. Error t-Statistic Prob. 489.8631 73.85524 6.632747 0.0000 INC 0.002893 0.000775 3.734180 0.0007 -10.07924 -265.8574 -0.001029 4.231494 0.0001 0.0250 0.2968 0.2542 AGE 2.229676 -4.520493 -2.345129 -1.059491 1.159827 SEX SEX*INC 113.3658 0.000971 3.648383 SEX*AGE R-squared 0.6470 Result (2) Ramsey RESET Test: F-statistic 2.110154 Probability 7.432899 Probability 0.119102 Log likelihood ratio 0.059308 Result (3) Breusch-Godfrey Serial Correlation LM Test: 0.545784 Probability 1.319452 Probability F-statistic 0.584685 Obs*R-squared 0.516993 Result (4) White Heteroskedasticity Test: 0.768684 Probability 7.495667 Probability F-statistic 0.645556 0.585656 Obs*R-squared Result (5) BE, = 459.21+ 0.0023 INC, - 8.42 AGE -169.87 SEX, R=0.6294 Result (6) BE; = 342.88+ 0.00238 INC, - 7.575 AGE R= 0.3292
Step by Step Solution
3.29 Rating (152 Votes )
There are 3 Steps involved in it
Part one The sample regression model would be BE4898631 0002893 INC 1007924 AGE 2858574 SEX 0001029 SEX INC 4231494 SEX AGE The Sample regression model for Male would be obtained if we insert SEX0 bec... View full answer

Get step-by-step solutions from verified subject matter experts