

Question: 1. Yellow-shaded cells require formulas. The E9 formula must copy down column E. F 9 formula must copy down column F. C17 formula should copy
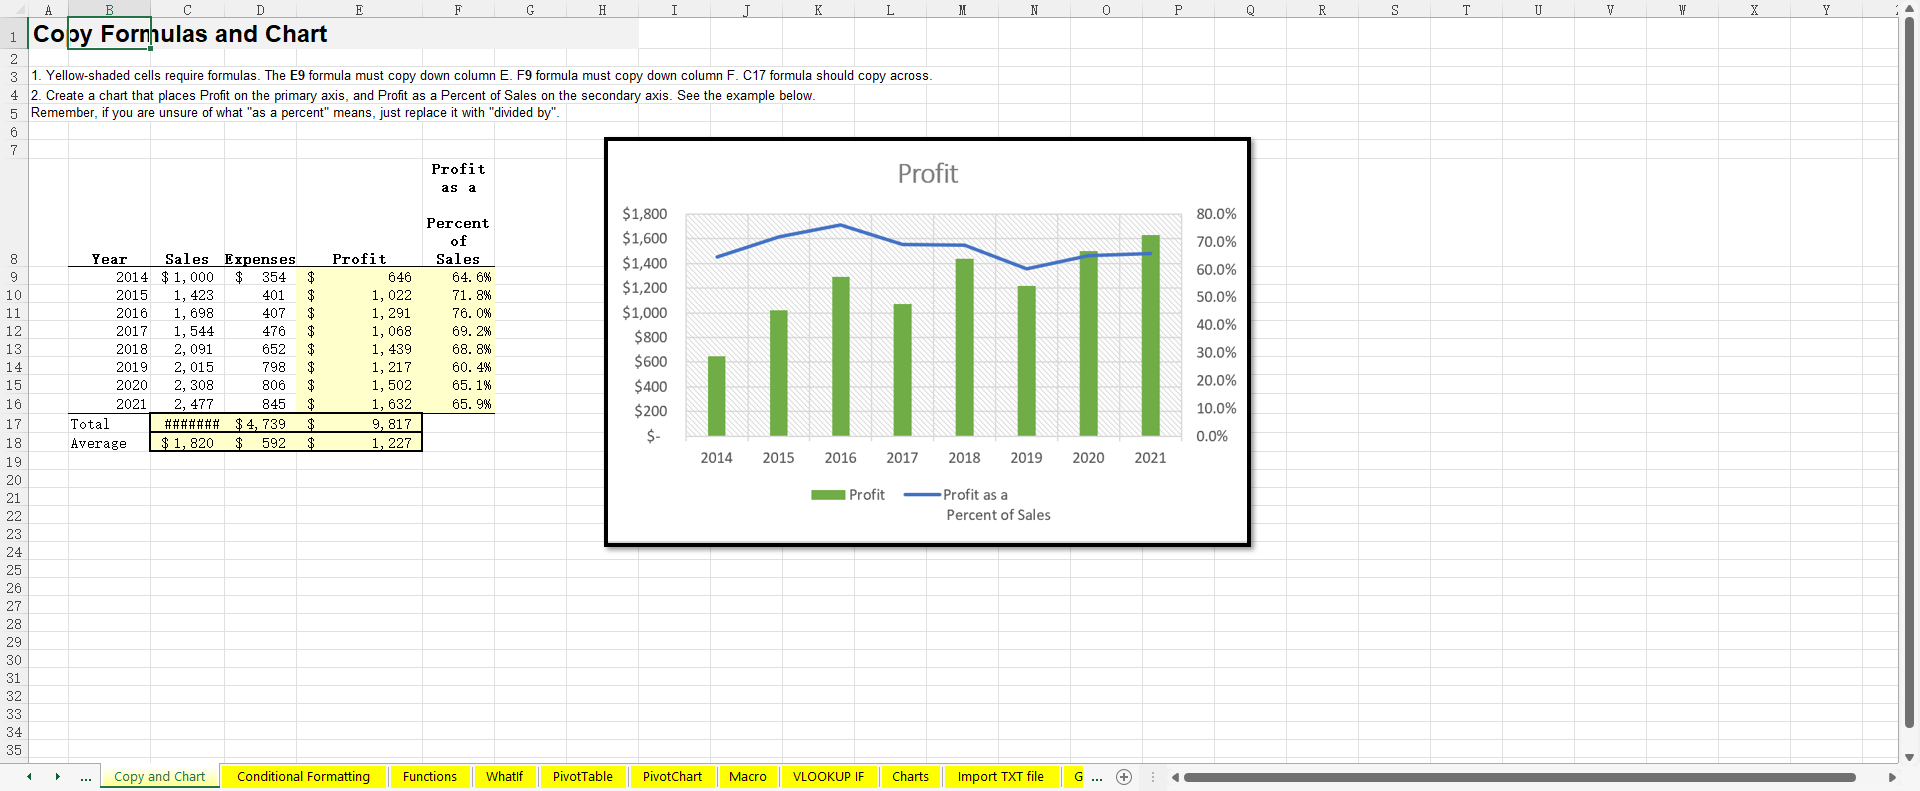
| 1. Yellow-shaded cells require formulas. The E9 formula must copy down column E. F9 formula must copy down column F. C17 formula should copy across. | |||||||||||
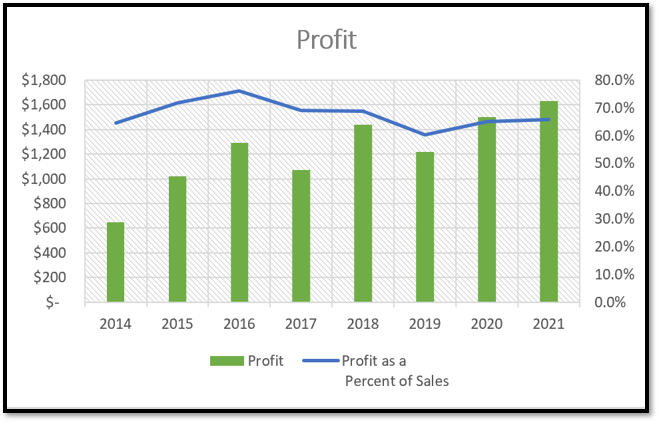
| 2. Create a chart that places Profit on the primary axis, and Profit as a Percent of Sales on the secondary axis. See the example below. | |||||||||||
| Remember, if you are unsure of what "as a percent" means, just replace it with "divided by". | |||||||||||
| Year | Sales | Expenses | Profit | Profit as a Percent of Sales | |
| 2014 | $1,000 | $ 354 | $ 646 | 64.6% | |
| 2015 | 1,423 | 401 | $ 1,022 | 71.8% | |
| 2016 | 1,698 | 407 | $ 1,291 | 76.0% | |
| 2017 | 1,544 | 476 | $ 1,068 | 69.2% | |
| 2018 | 2,091 | 652 | $ 1,439 | 68.8% | |
| 2019 | 2,015 | 798 | $ 1,217 | 60.4% | |
| 2020 | 2,308 | 806 | $ 1,502 | 65.1% | |
| 2021 | 2,477 | 845 | $ 1,632 | 65.9% | |
| Total | ######## | $4,739 | $ 9,817 | ||
| Average | $1,820 | $ 592 | $ 1,227 |
Step by Step Solution
There are 3 Steps involved in it
1 Expert Approved Answer
Step: 1 Unlock

Question Has Been Solved by an Expert!
Get step-by-step solutions from verified subject matter experts
Step: 2 Unlock
Step: 3 Unlock