

Question: 10 = 0 n = 100 M = = 50 = 20 X 0 Value of density curve 0.00 0.02 0.04 0.06 0.08 5


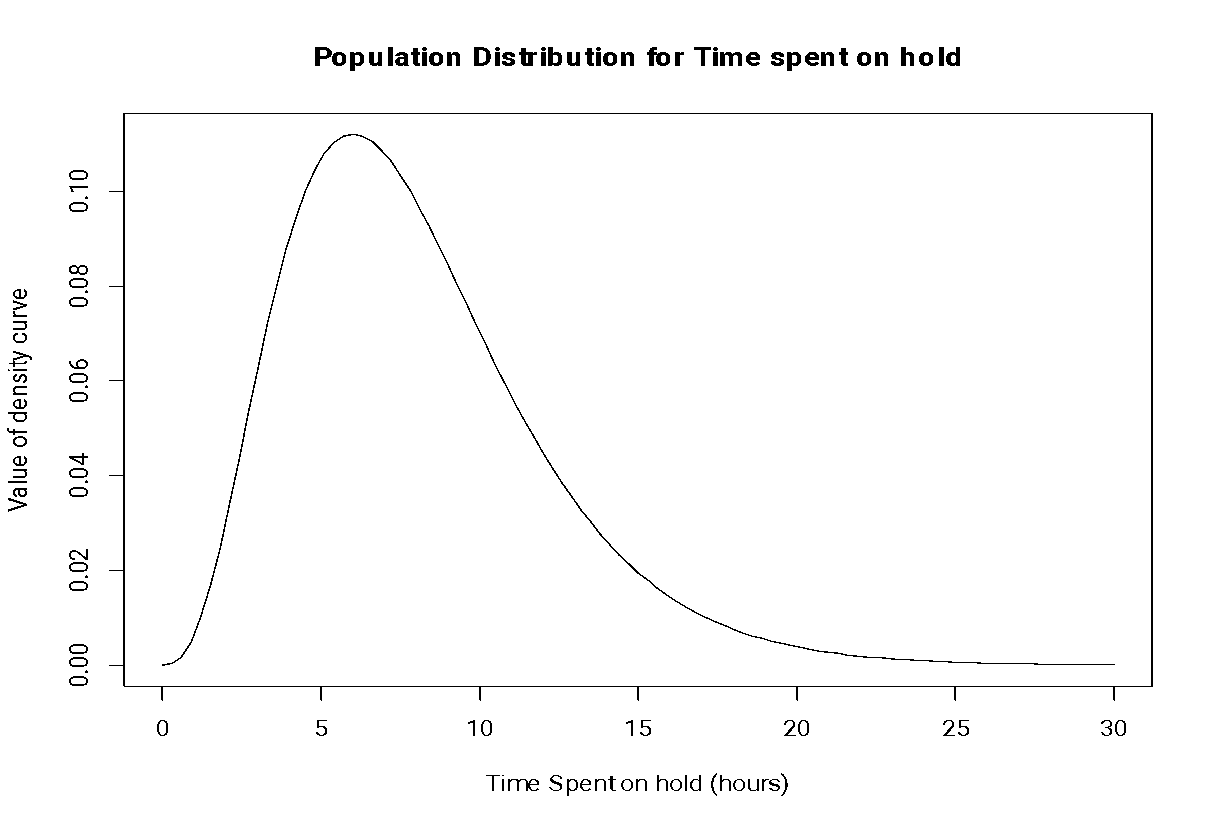


10 = 0 n = 100 M = = 50 = 20 X 0 Value of density curve 0.00 0.02 0.04 0.06 0.08 5 10 15 20 25 30 Time Spent on hold (hours) 0.10 Population Distribution for Time spent on hold P( 1 < < + 1) X X n = 6 n = 36 X X = 80 = 10 n = 6 == n || n n = 36 X X n = 5 X X X = 4 = 4 = n n = 5 n = 64 n X
Step by Step Solution
There are 3 Steps involved in it
1 Expert Approved Answer
Step: 1 Unlock

Question Has Been Solved by an Expert!
Get step-by-step solutions from verified subject matter experts
Step: 2 Unlock
Step: 3 Unlock