

Question: 10 11 12 13 Create a 3-D clustered column chart using the data for the Semi-Annual Totals for all auto types on the AnnualData worksheet.
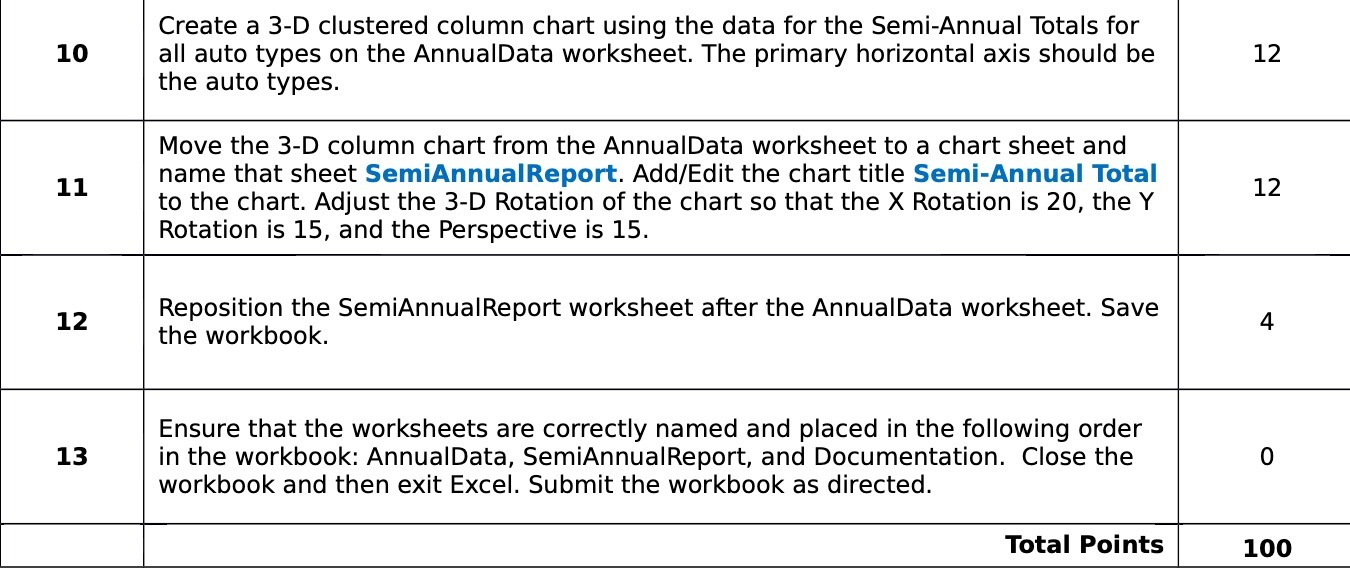
10 11 12 13 Create a 3-D clustered column chart using the data for the Semi-Annual Totals for all auto types on the AnnualData worksheet. The primary horizontal axis should be the auto types. Move the 3-D column chart from the AnnualData worksheet to a chart sheet and name that sheet SemiAnnualReport. AddIEdit the chart title Semi-Annual Total to the chart. Adjust the 3-D Rotation of the chart so that the X Rotation is 20, the Y Rotation is 15, and the Perspective is 15. Reposition the SemiAnnualReport worksheet after the AnnualData worksheet. Save the workbook. Ensure that the worksheets are correctly named and placed in the following order in the workbook: AnnualData, SemiAnnualReport, and Documentation. Close the workbook and then exit Excel. Submit the workbook as directed. Total Points 12 12 100
Step by Step Solution
There are 3 Steps involved in it

Get step-by-step solutions from verified subject matter experts