

Question: 10 9 8 Supply 7 6 Price ($) per unit 5 4 3 Demand 2 7 6 Price ($) per unit 5 4 3 Demand
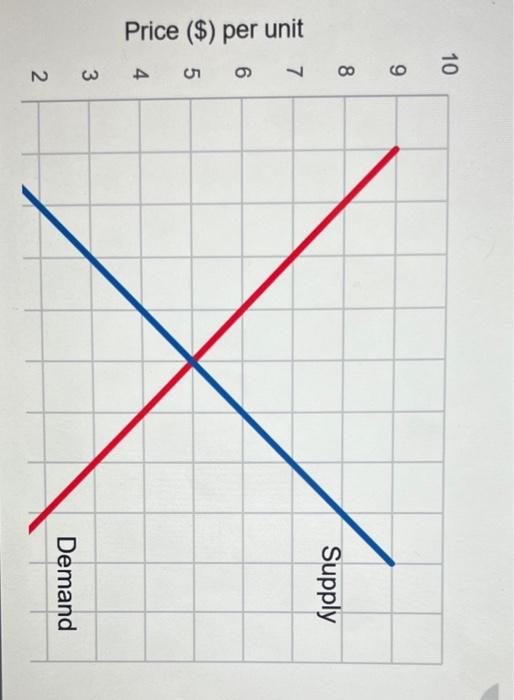
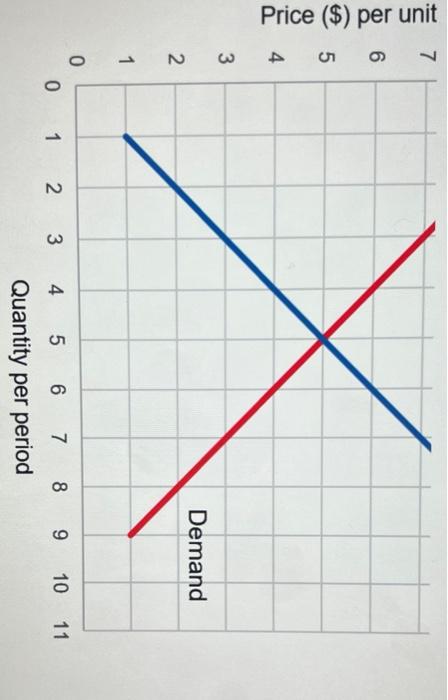
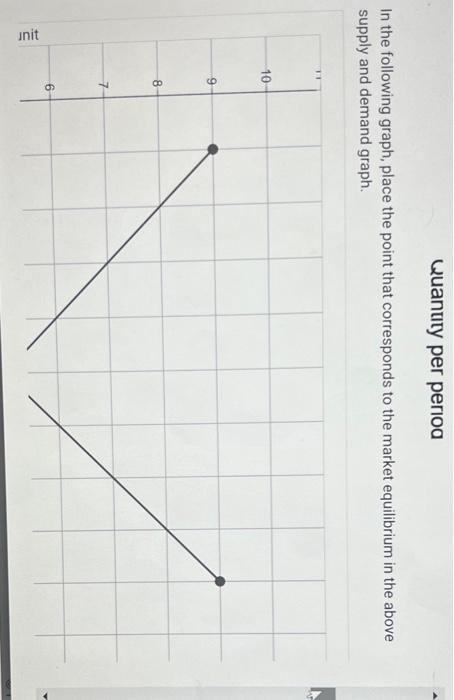
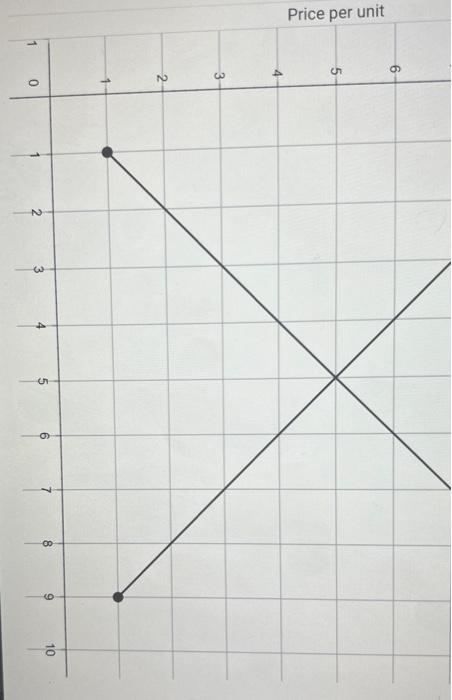
10 9 8 Supply 7 6 Price ($) per unit 5 4 3 Demand 2 7 6 Price ($) per unit 5 4 3 Demand N 1 0 0 1 2 3 . 10 11 4 5 6 7 8 9 5 Quantity per period Quantity per period In the following graph, place the point that corresponds to the market equilibrium in the above supply and demand graph. 10 9 8 7 6 unit 6 Price per unit 5 4 3 2 1 7 10 8 5 9 9 3 2 1 0
Step by Step Solution
There are 3 Steps involved in it
1 Expert Approved Answer
Step: 1 Unlock

Question Has Been Solved by an Expert!
Get step-by-step solutions from verified subject matter experts
Step: 2 Unlock
Step: 3 Unlock