

Question: Suppose a $1 excise or commodity tax is placed on the purchasers of cans of soda. Use the graph to illustrate the impact this tax
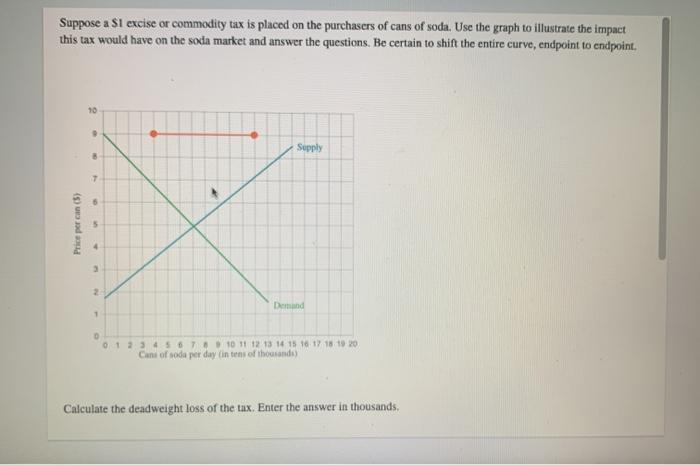
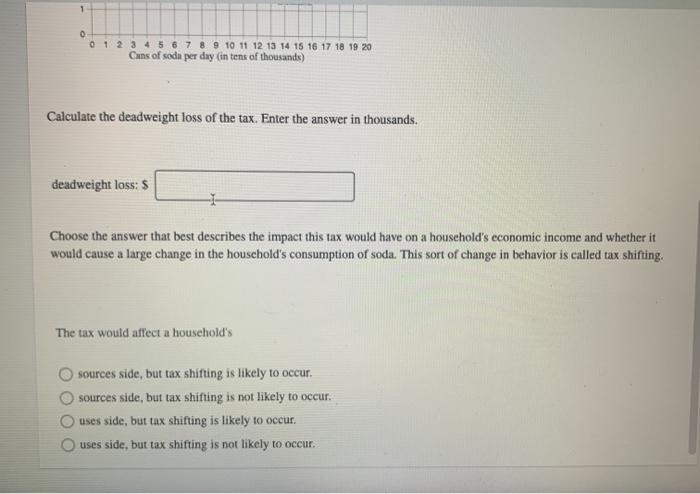
Suppose a $1 excise or commodity tax is placed on the purchasers of cans of soda. Use the graph to illustrate the impact this tax would have on the soda market and answer the questions. Be certain to shift the entire curve, endpoint to endpoint. 10 Supply 7 6 Price per con (5) 3 Demand 1 0 1 2 3 4 5 6 8 10 11 12 13 14 15 16 17 18 19 20 Cans of soda per day in tens of thousands) Calculate the deadweight loss of the tax Enter the answer in thousands 1 0 0 1 2 3 4 5 6 7 8 9 10 11 12 13 14 15 16 17 18 19 20 Cans of soda per day (in tens of thousands) Calculate the deadweight loss of the tax. Enter the answer in thousands. deadweight loss: $ Choose the answer that best describes the impact this tax would have on a household's economic income and whether it would cause a large change in the household's consumption of soda. This sort of change in behavior is called tax shifting. The tax would affect a household's sources side, but tax shifting is likely to occur. sources side, but tax shifting is not likely to occur. uses side, but tax shifting is likely to occur. uses side, but tax shifting is not likely to occur
Step by Step Solution
There are 3 Steps involved in it

Get step-by-step solutions from verified subject matter experts