

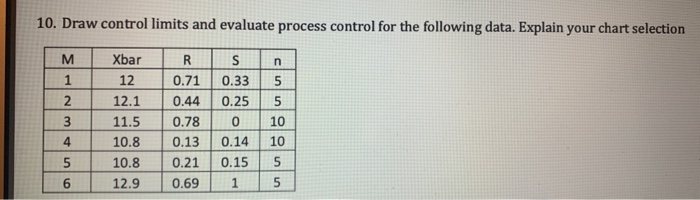
Question: 10. Draw control limits and evaluate process control for the following data. Explain your chart selection M R 2 3 Xbar 12 12.1 11.5 10.8
Step by Step Solution
There are 3 Steps involved in it
1 Expert Approved Answer
Step: 1 Unlock

Question Has Been Solved by an Expert!
Get step-by-step solutions from verified subject matter experts
Step: 2 Unlock
Step: 3 Unlock