Question: Part A: Determining Control Limits (Data for these questions is given in the spreadsheet) Among its many different criterion for quality assurance, the Bumetas Brewery
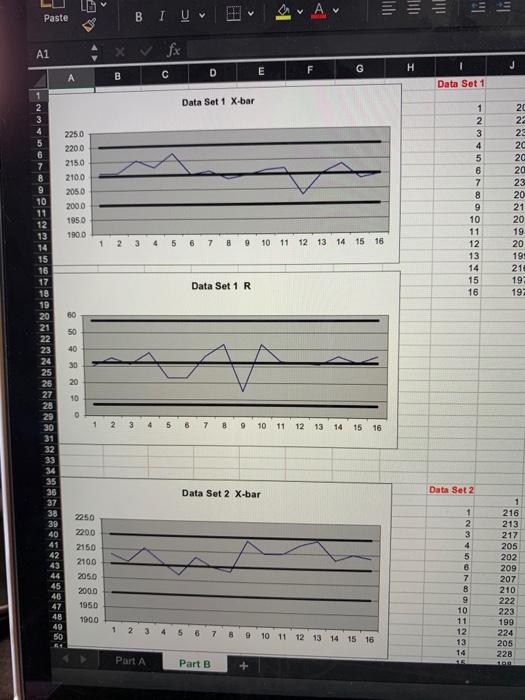
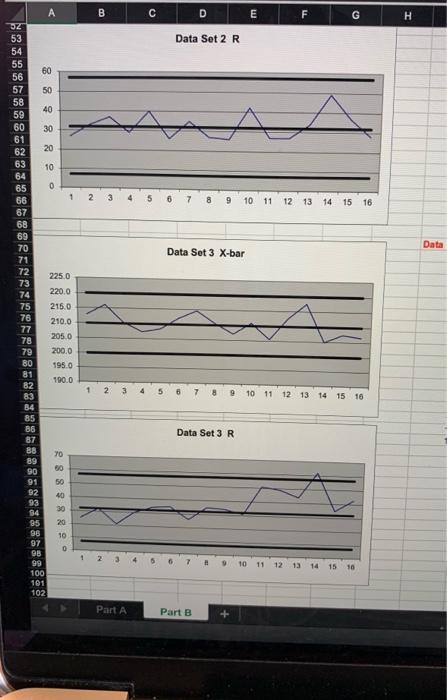
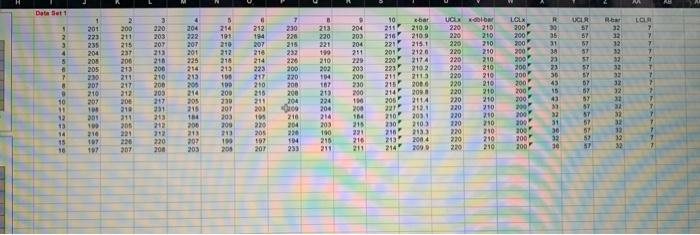
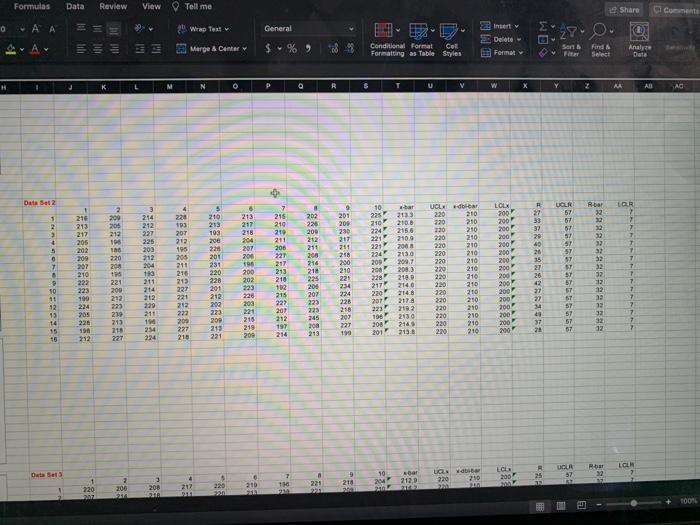
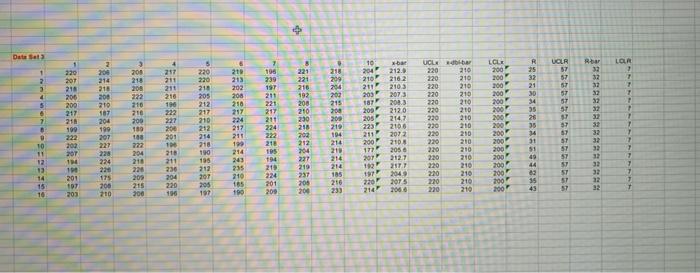
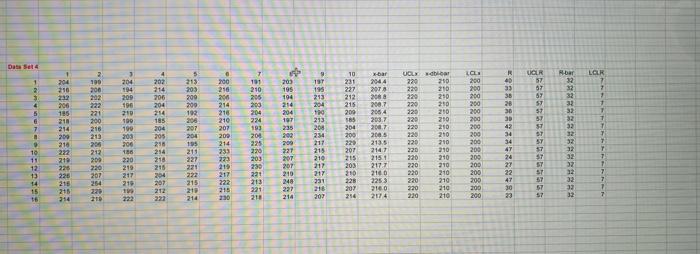
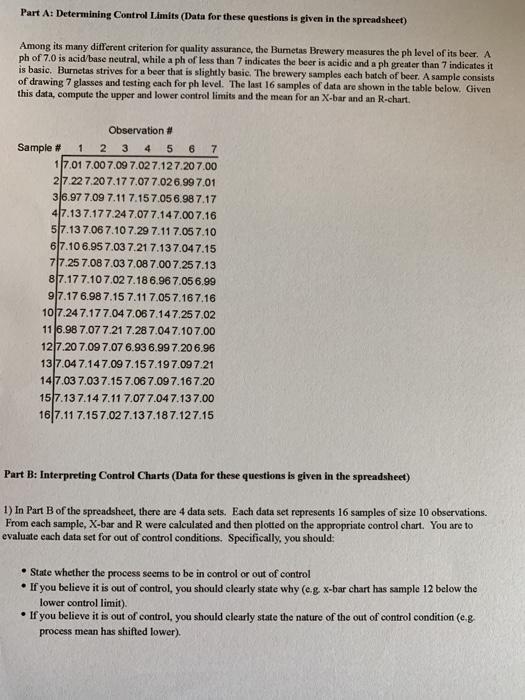
Part A: Determining Control Limits (Data for these questions is given in the spreadsheet) Among its many different criterion for quality assurance, the Bumetas Brewery measures the ph level of its beer. A ph of 7.0 is acid base neutral, while a ph of less than 7 indicates the beer is acidic and a ph greater than 7 indicates it is basic. Burnetas strives for a beer that is slightly basie. The brewery samples each batch of beer. A sample consists of drawing 7 glasses and testing each for ph level. The last 16 samples of data are shown in the table below. Given this data, compute the upper and lower control limits and the mean for an X-bar and an R-chart. Observation # Sample # 1 2 3 4 5 6 7 117.01 7.00 7.09 7.02 7.127.20 7.00 217.227.20 7.17 7.07 7.026.997.01 36.97 7.09 7.11 7.157.056.98 7.17 47.13 7.177.24 7.07 7.147.00 7.16 5 7.137.06 7.10 7.29 7.11 7.057.10 6/7.10 6.95 7.03 7.21 7.13 7.047.15 7 7.25 7.08 7.03 7.08 7.00 7.25 7.13 8/7.17 7.10 7.02 7.18 6.96 7.05 6.99 97.17 6.987.15 7.11 7.057.16 7.16 10 7.24 7.177.04 7.06 7.147.25 7.02 116.98 7.07 7.21 7.28 7.04 7.10 7.00 1217.20 7.09 7.07 6.93 6.99 7.20 6.96 13 7.04 7.147.09 7.15 7.19 7.09 7.21 147.037.03 7.15 7.06 7.09 7.167.20 157.13 7.14 7.11 7.07 7.04 7.137.00 167.11 7.157.02 7.137.187.127.15 Part B: Interpreting Control Charts (Data for these questions is given in the spreadsheet) 1) In Part B of the spreadsheet, there are 4 data sets. Each data set represents 16 samples of size 10 observations. From each sample, X-bar and R were calculated and then plotted on the appropriate control chart. You are to evaluate each data set for out of control conditions. Specifically, you should State whether the process seems to be in control or out of control If you believe it is out of control, you should clearly state why (e.g x-bar chart has sample 12 below the lower control limit) If you believe it is out of control, you should clearly state the nature of the out of control condition (eg process mean has shifted lower). ~A~ BIU = = Paste A1 D E H F C B A Data Set 1 Data Set 1 X-bar 1 2 3 4 1 2 3 4 6 7 225.0 2200 2150 2100 2050 2000 195.0 9 10 11 12 5 6 7 8 9 10 11 12 13 14 15 16 20 22 25 20 20 20 23 20 21 20 19 20 198 210 19 19 1900 1 23 4 5 7 8 9 10 11 12 13 14 15 16 Data Set 1 R 14 15 16 17 18 19 20 21 22 23 24 25 26 60 50 40 30 20 10 0 1 2 3 4 10 11 12 13 14 15 16 Data Set 2 X-bar Data Set 2 2250 29 30 31 32 33 34 35 36 37 38 39 40 41 42 43 44 45 46 47 48 49 50 1 216 213 217 205 202 209 2200 2150 2100 2050 2000 1950 1900 1 2 3 4 5 6 7 9 10 11 12 13 14 207 210 222 223 199 224 205 228 10 1 2 3 4 7 9 10 11 12 13 14 15 16 Part A Part B A B C D E G H Data Set 2 R 60 50 40 A A 30 20 10 0 1 2. 3 4 5 9 10 11 12 13 14 15 16 32 53 54 55 56 57 58 59 60 61 62 63 64 65 66 67 68 69 70 71 72 73 74 75 76 77 78 79 80 81 82 Data Data Set 3 X-bar 225.0 220.0 215.0 210.0 205.0 200.0 1950 190.0 1 2 8 9 10 11 12 13 14 15 16 Data Set 3 R 70 80 50 84 85 86 87 88 89 90 91 S2 93 34 85 98 97 98 99 100 101 40 30 20 10 1 10 11 12 13 14 15 16 102 Part A Part B 93 30 94 95 20 2 3 5 6 7 8 9 10 11 12 13 14 15 16 96 10 97 0 98 1 99 100 101 102 103 104 105 106 107 2300 108 109 2250 2200 110 215.0 112 2100 Data Set 4 X-bar 111 113 2050 114 2000 115 1950 116 190.0 117 1850 1 2 3 8 9 10 11 12 13 14 15 16 118 119 120 121 122 123 124 80 125 Data Set 4 R 126 50 131 127 128 129 30 130 20 13210 133 134 0 135 136 137 138 139 140 141 142 143 1 3 10 11 12 13 14 15 16 Part A Part B Data Set 1 5 . 10 LOR 5 57 8 213 230 221 204 222 207 2013 191 210 LOL 300 200 200 211 26 7 R 39 35 31 38 201 223 235 204 200 205 12 2 200 211 215 23 200 213 211 217 212 200 210 211 205 5 . 2. 3 220 203 207 213 210 200 210 200 203 217 351 313 CE LE PLE CIE 001 7 230 220 215 233 220 200 220 200 200 300 210 202 104 37 ST SF SY SY 23 SE s-bar 210.9 2100 215 2120 2174 2102 2113 2006 2008 2014 2011 203 212 194 207 210 214 223 217 210 21. 211 1 205 197 207 221 201 270 23 273 211 214 215 214 227 210 214 213 200 214 305 215 154 300 9 204 203 204 211 220 203 200 230 200 100 200 1M 221 210 211 210 210 210 210 210 210 210 210 210 210 210 210 UCL 220 220 220 220 220 220 220 220 220 720 220 220 220 220 220 220 300 300 200 300 200 200 32 33 32 32 # CP 201 210 207 100 301 10 10 200 230 20T 203 309 (9 49 9 10 2015 12 212 224 200 214 203 190 215 211 30 0 210 204 104 253 ! 2103 2133 31 30 100 300 200 200 200 57 212 220 200 33 32 32 2 15 10 199 20 307 207 203 210 210 210 203 2147 2004 2008 DE ST 20 Formulas Data Review View Tell me Share 0 2 Wrap Tout General inert Delete P. OM AY Merge & Center $. % ) Santa Conditional Format Cat Formatting as Table Styles Forma Find Select Analyse Data H M N 0 R 5 T V NA X AA All AC Data Set 2 R 27 LOR 2 1 220 9 201 205 230 8 202 226 200 212 UGLR 57 67 57 2133 2100 2150 3 214 212 227 225 203 112 304 10 275 210 224 22 7 213 217 218 204 207 200 2109 20 40 7 221 224 5 210 213 103 200 228 201 231 220 SAM 228 201 212 200 200 210 210 7 209 2007 210 213 217 205 202 2009 207 210 222 223 199 224 205 220 196 212 200 206 213 10 TA 220 302 20 11 294 221 200 200 212 223 239 213 218 227 35 27 216 210 210 211 200 227 207 213 210 12 215 22 207 212 197 214 207 212 195 205 210 210 215 227 221 212 222 200 227 210 UCL dar 220 210 220 210 220 210 230 210 2.30 40 210 230 210 230 210 220 210 220 210 20 210 220 210 220 210 220 210 220 210 220 210 220 210 LOL 200 200 200 200 200 200 200 200 200 200 200 200 200 200 200 200 1 218 200 210 221 234 924 220 218 207 32 T 7 7 32 32 13 12 53 32 12 12 200 202 223 226 203 221 215 219 200 2 10 40 12 13 14 15 16 42 313 214 212 220 211 1 254 224 2003 2130 2002 218 2140 2140 217 2102 2030 2149 2130 200 207 223 223 245 200 22 27 220 20 223 27 14 43 37 21 12 32 32 12 200 200 213 221 57 57 7 7 190 201 LGER Data Set 10 204 LOR 200 bar 2129 U do 220 210 12 $ 220 mon 26 SE BE 218 210 DE 208 220 207 206 217 21 221 22 VE 100 > Data Set 2 LOUR 1 2 3 4 5 1 220 207 218 206 209 217 211 100 R 25 32 21 32 32 4 217 211 211 210 100 100 222 218 209 204 200 215 10 204 210 21 203 187 20 2120 2162 2103 2073 UGLR 57 57 67 57 LOLE 200 200 2009 200 , 200 200 2001 7 208 218 200 222 210 710 200 10 100 222 294 218 13 52 37 7 214 218 200 210 107 204 199 207 227 220 224 220 175 200 710 5 220 220 210 205 212 21 917 210 22 214 310 190 135 196 212 207 205 197 6 210 213 202 200 210 217 224 317 211 10 214 249 235 210 165 190 7 198 239 197 211 217 211 224 14 4 218 105 04 210 224 201 200 3 221 221 216 192 208 210 230 200 200 212 204 MAN 227 219 237 200 200 OCE 2120 214 2106 2012 2103 2056 UCLX 40 210 220 210 220 210 220 210 220 210 220 210 230 210 210 220 210 220 210 220 210 220 210 220 210 220 210 220 210 220 210 223" 211 200 17 32 20 20 200 210 104 214 211 214 214 185 210 233 3127 200 207 1 1 201 107 203 51 49 44 200 200 200" 200 200 200 200 200 218 211 230 204 220 156 2177 97 ST ST SY SY 57 ST ST 37 42 209 215 200 7 7 7 T 32 32 32 2075 2006 Das Set ope Ten UCER LAR * 202 214 204 194 200 196 * 20 200 THE 200 s 30 - HORE 193 20 225 *5 PE 203 - DAN -- 2002 210 2037 32 310 2007 2004 210 2202135 220 21 214 220 210 2151 220 210 217 220 2100 220 200 427 32 34 7 92 34 712 475733 20 30 212 209 720 207 254 935 211 327 203 3 222 210 226 -- 215 215 211 220 219 217 219 215 204 207 212 RE 222 315 210 214 14 15 213248 221 18 Part A: Determining Control Limits (Data for these questions is given in the spreadsheet) Among its many different criterion for quality assurance, the Bumetas Brewery measures the ph level of its beer. A ph of 7.0 is acid base neutral, while a ph of less than 7 indicates the beer is acidic and a ph greater than 7 indicates it is basic. Burnetas strives for a beer that is slightly basie. The brewery samples each batch of beer. A sample consists of drawing 7 glasses and testing each for ph level. The last 16 samples of data are shown in the table below. Given this data, compute the upper and lower control limits and the mean for an X-bar and an R-chart. Observation # Sample # 1 2 3 4 5 6 7 117.01 7.00 7.09 7.02 7.127.20 7.00 217.227.20 7.17 7.07 7.026.997.01 36.97 7.09 7.11 7.157.056.98 7.17 47.13 7.177.24 7.07 7.147.00 7.16 5 7.137.06 7.10 7.29 7.11 7.057.10 6/7.10 6.95 7.03 7.21 7.13 7.047.15 7 7.25 7.08 7.03 7.08 7.00 7.25 7.13 8/7.17 7.10 7.02 7.18 6.96 7.05 6.99 97.17 6.987.15 7.11 7.057.16 7.16 10 7.24 7.177.04 7.06 7.147.25 7.02 116.98 7.07 7.21 7.28 7.04 7.10 7.00 1217.20 7.09 7.07 6.93 6.99 7.20 6.96 13 7.04 7.147.09 7.15 7.19 7.09 7.21 147.037.03 7.15 7.06 7.09 7.167.20 157.13 7.14 7.11 7.07 7.04 7.137.00 167.11 7.157.02 7.137.187.127.15 Part B: Interpreting Control Charts (Data for these questions is given in the spreadsheet) 1) In Part B of the spreadsheet, there are 4 data sets. Each data set represents 16 samples of size 10 observations. From each sample, X-bar and R were calculated and then plotted on the appropriate control chart. You are to evaluate each data set for out of control conditions. Specifically, you should State whether the process seems to be in control or out of control If you believe it is out of control, you should clearly state why (e.g x-bar chart has sample 12 below the lower control limit) If you believe it is out of control, you should clearly state the nature of the out of control condition (eg process mean has shifted lower). ~A~ BIU = = Paste A1 D E H F C B A Data Set 1 Data Set 1 X-bar 1 2 3 4 1 2 3 4 6 7 225.0 2200 2150 2100 2050 2000 195.0 9 10 11 12 5 6 7 8 9 10 11 12 13 14 15 16 20 22 25 20 20 20 23 20 21 20 19 20 198 210 19 19 1900 1 23 4 5 7 8 9 10 11 12 13 14 15 16 Data Set 1 R 14 15 16 17 18 19 20 21 22 23 24 25 26 60 50 40 30 20 10 0 1 2 3 4 10 11 12 13 14 15 16 Data Set 2 X-bar Data Set 2 2250 29 30 31 32 33 34 35 36 37 38 39 40 41 42 43 44 45 46 47 48 49 50 1 216 213 217 205 202 209 2200 2150 2100 2050 2000 1950 1900 1 2 3 4 5 6 7 9 10 11 12 13 14 207 210 222 223 199 224 205 228 10 1 2 3 4 7 9 10 11 12 13 14 15 16 Part A Part B A B C D E G H Data Set 2 R 60 50 40 A A 30 20 10 0 1 2. 3 4 5 9 10 11 12 13 14 15 16 32 53 54 55 56 57 58 59 60 61 62 63 64 65 66 67 68 69 70 71 72 73 74 75 76 77 78 79 80 81 82 Data Data Set 3 X-bar 225.0 220.0 215.0 210.0 205.0 200.0 1950 190.0 1 2 8 9 10 11 12 13 14 15 16 Data Set 3 R 70 80 50 84 85 86 87 88 89 90 91 S2 93 34 85 98 97 98 99 100 101 40 30 20 10 1 10 11 12 13 14 15 16 102 Part A Part B 93 30 94 95 20 2 3 5 6 7 8 9 10 11 12 13 14 15 16 96 10 97 0 98 1 99 100 101 102 103 104 105 106 107 2300 108 109 2250 2200 110 215.0 112 2100 Data Set 4 X-bar 111 113 2050 114 2000 115 1950 116 190.0 117 1850 1 2 3 8 9 10 11 12 13 14 15 16 118 119 120 121 122 123 124 80 125 Data Set 4 R 126 50 131 127 128 129 30 130 20 13210 133 134 0 135 136 137 138 139 140 141 142 143 1 3 10 11 12 13 14 15 16 Part A Part B Data Set 1 5 . 10 LOR 5 57 8 213 230 221 204 222 207 2013 191 210 LOL 300 200 200 211 26 7 R 39 35 31 38 201 223 235 204 200 205 12 2 200 211 215 23 200 213 211 217 212 200 210 211 205 5 . 2. 3 220 203 207 213 210 200 210 200 203 217 351 313 CE LE PLE CIE 001 7 230 220 215 233 220 200 220 200 200 300 210 202 104 37 ST SF SY SY 23 SE s-bar 210.9 2100 215 2120 2174 2102 2113 2006 2008 2014 2011 203 212 194 207 210 214 223 217 210 21. 211 1 205 197 207 221 201 270 23 273 211 214 215 214 227 210 214 213 200 214 305 215 154 300 9 204 203 204 211 220 203 200 230 200 100 200 1M 221 210 211 210 210 210 210 210 210 210 210 210 210 210 210 UCL 220 220 220 220 220 220 220 220 220 720 220 220 220 220 220 220 300 300 200 300 200 200 32 33 32 32 # CP 201 210 207 100 301 10 10 200 230 20T 203 309 (9 49 9 10 2015 12 212 224 200 214 203 190 215 211 30 0 210 204 104 253 ! 2103 2133 31 30 100 300 200 200 200 57 212 220 200 33 32 32 2 15 10 199 20 307 207 203 210 210 210 203 2147 2004 2008 DE ST 20 Formulas Data Review View Tell me Share 0 2 Wrap Tout General inert Delete P. OM AY Merge & Center $. % ) Santa Conditional Format Cat Formatting as Table Styles Forma Find Select Analyse Data H M N 0 R 5 T V NA X AA All AC Data Set 2 R 27 LOR 2 1 220 9 201 205 230 8 202 226 200 212 UGLR 57 67 57 2133 2100 2150 3 214 212 227 225 203 112 304 10 275 210 224 22 7 213 217 218 204 207 200 2109 20 40 7 221 224 5 210 213 103 200 228 201 231 220 SAM 228 201 212 200 200 210 210 7 209 2007 210 213 217 205 202 2009 207 210 222 223 199 224 205 220 196 212 200 206 213 10 TA 220 302 20 11 294 221 200 200 212 223 239 213 218 227 35 27 216 210 210 211 200 227 207 213 210 12 215 22 207 212 197 214 207 212 195 205 210 210 215 227 221 212 222 200 227 210 UCL dar 220 210 220 210 220 210 230 210 2.30 40 210 230 210 230 210 220 210 220 210 20 210 220 210 220 210 220 210 220 210 220 210 220 210 LOL 200 200 200 200 200 200 200 200 200 200 200 200 200 200 200 200 1 218 200 210 221 234 924 220 218 207 32 T 7 7 32 32 13 12 53 32 12 12 200 202 223 226 203 221 215 219 200 2 10 40 12 13 14 15 16 42 313 214 212 220 211 1 254 224 2003 2130 2002 218 2140 2140 217 2102 2030 2149 2130 200 207 223 223 245 200 22 27 220 20 223 27 14 43 37 21 12 32 32 12 200 200 213 221 57 57 7 7 190 201 LGER Data Set 10 204 LOR 200 bar 2129 U do 220 210 12 $ 220 mon 26 SE BE 218 210 DE 208 220 207 206 217 21 221 22 VE 100 > Data Set 2 LOUR 1 2 3 4 5 1 220 207 218 206 209 217 211 100 R 25 32 21 32 32 4 217 211 211 210 100 100 222 218 209 204 200 215 10 204 210 21 203 187 20 2120 2162 2103 2073 UGLR 57 57 67 57 LOLE 200 200 2009 200 , 200 200 2001 7 208 218 200 222 210 710 200 10 100 222 294 218 13 52 37 7 214 218 200 210 107 204 199 207 227 220 224 220 175 200 710 5 220 220 210 205 212 21 917 210 22 214 310 190 135 196 212 207 205 197 6 210 213 202 200 210 217 224 317 211 10 214 249 235 210 165 190 7 198 239 197 211 217 211 224 14 4 218 105 04 210 224 201 200 3 221 221 216 192 208 210 230 200 200 212 204 MAN 227 219 237 200 200 OCE 2120 214 2106 2012 2103 2056 UCLX 40 210 220 210 220 210 220 210 220 210 220 210 230 210 210 220 210 220 210 220 210 220 210 220 210 220 210 220 210 220 210 223" 211 200 17 32 20 20 200 210 104 214 211 214 214 185 210 233 3127 200 207 1 1 201 107 203 51 49 44 200 200 200" 200 200 200 200 200 218 211 230 204 220 156 2177 97 ST ST SY SY 57 ST ST 37 42 209 215 200 7 7 7 T 32 32 32 2075 2006 Das Set ope Ten UCER LAR * 202 214 204 194 200 196 * 20 200 THE 200 s 30 - HORE 193 20 225 *5 PE 203 - DAN -- 2002 210 2037 32 310 2007 2004 210 2202135 220 21 214 220 210 2151 220 210 217 220 2100 220 200 427 32 34 7 92 34 712 475733 20 30 212 209 720 207 254 935 211 327 203 3 222 210 226 -- 215 215 211 220 219 217 219 215 204 207 212 RE 222 315 210 214 14 15 213248 221 18
There are 3 Steps involved in it
Step: 1 Unlock

Step: 2 Unlock
Step: 3 Unlock