

Question: 10 Frequency 00 8 9 2 0 .00 00 Histogram Mean = Std. De N=105 2.00 4.00 6.00 8.00 10.00 12.00 SPEE_10units What is
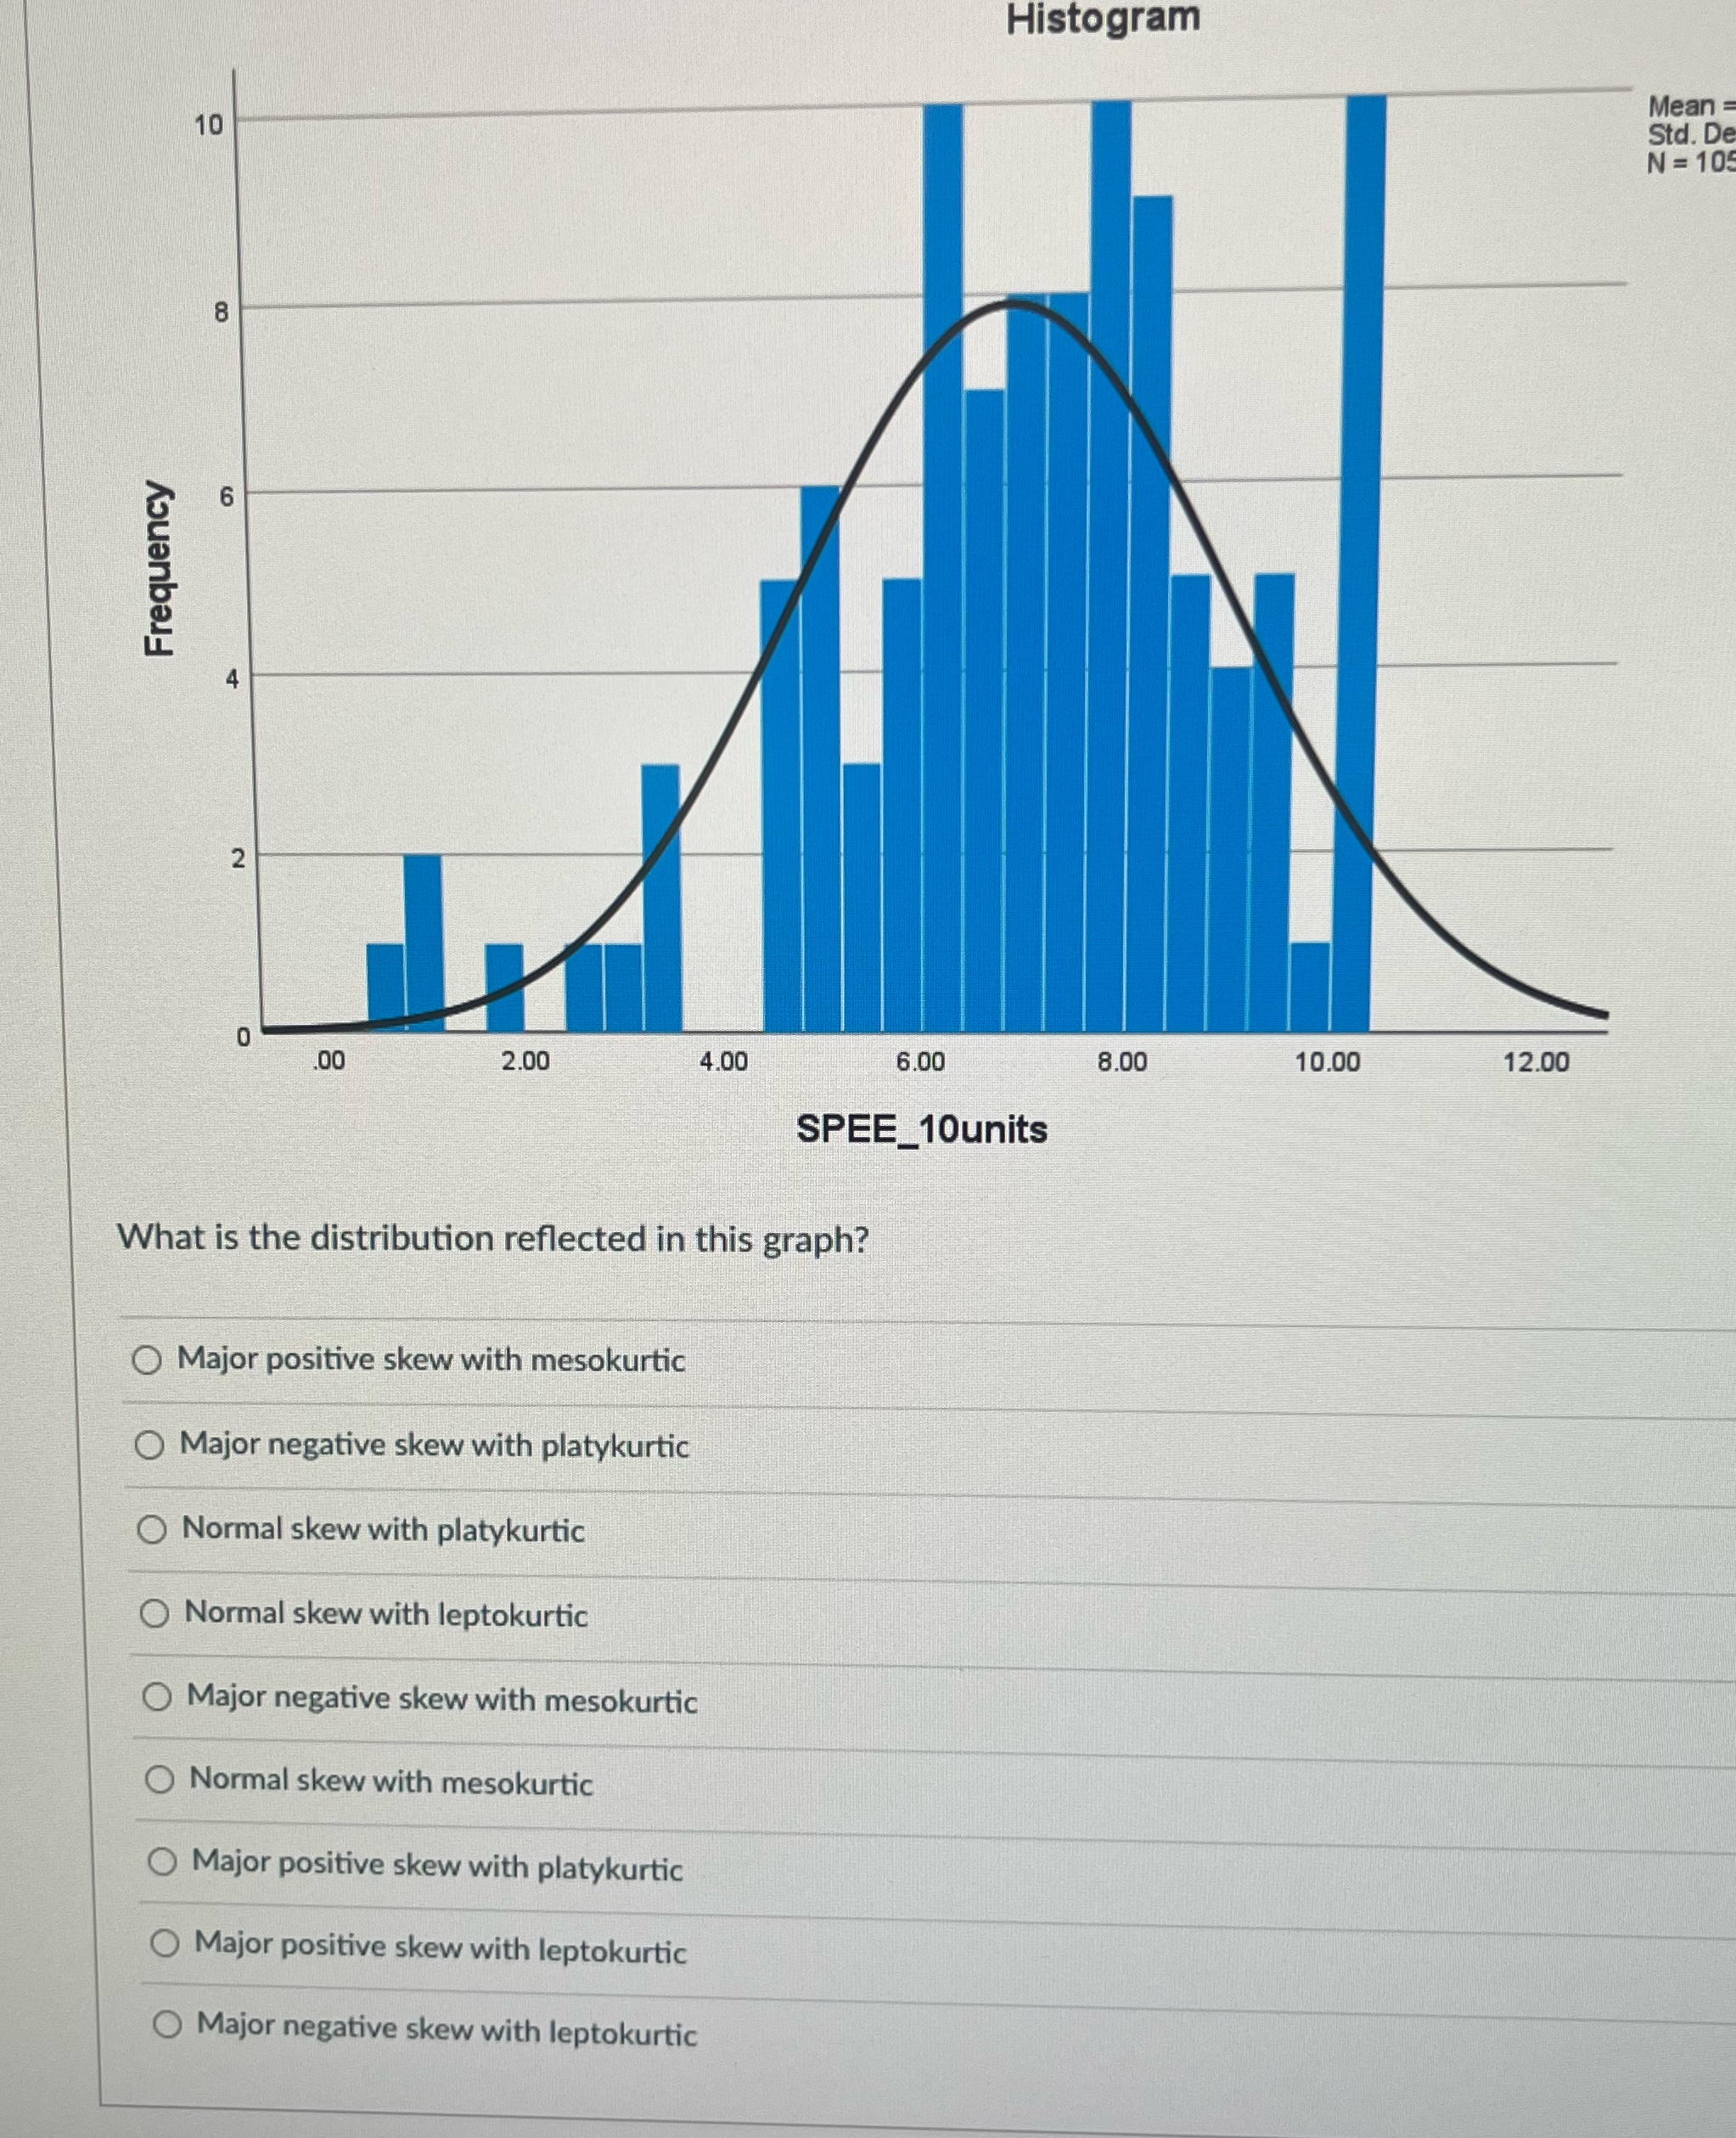
10 Frequency 00 8 9 2 0 .00 00 Histogram Mean = Std. De N=105 2.00 4.00 6.00 8.00 10.00 12.00 SPEE_10units What is the distribution reflected in this graph? Major positive skew with mesokurtic Major negative skew with platykurtic O Normal skew with platykurtic O Normal skew with leptokurtic O Major negative skew with mesokurtic O Normal skew with mesokurtic O Major positive skew with platykurtic Major positive skew with leptokurtic O Major negative skew with leptokurtic
Step by Step Solution
There are 3 Steps involved in it
1 Expert Approved Answer
Step: 1 Unlock

Question Has Been Solved by an Expert!
Get step-by-step solutions from verified subject matter experts
Step: 2 Unlock
Step: 3 Unlock