

Question: 10 Graph 1 Graph 2 10 7 Graph 3 number of bacteria number of bacteria hours hours hour Graph 1: No antibiotics Graph 2: Antibiotics
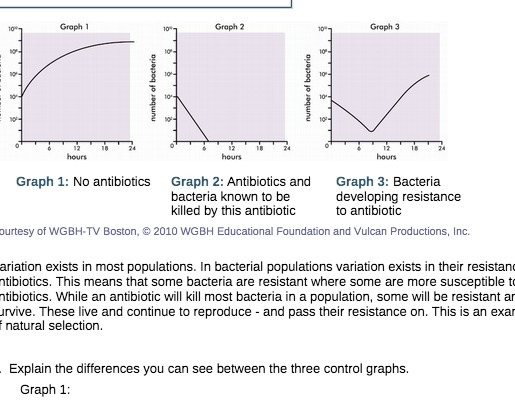
10 Graph 1 Graph 2 10 7 Graph 3 number of bacteria number of bacteria hours hours hour Graph 1: No antibiotics Graph 2: Antibiotics and Graph 3: Bacteria bacteria known to be developing resistance killed by this antibiotic to antibiotic ourtesy of WGBH-TV Boston, @ 2010 WGBH Educational Foundation and Vulcan Productions, Inc. ariation exists in most populations. In bacterial populations variation exists in their resistant tibiotics. This means that some bacteria are resistant where some are more susceptible to tibiotics. While an antibiotic will kill most bacteria in a population, some will be resistant ar urvive. These live and continue to reproduce - and pass their resistance on. This is an exar natural selection. Explain the differences you can see between the three control graphs. Graph 1
Step by Step Solution
There are 3 Steps involved in it

Get step-by-step solutions from verified subject matter experts