Question: 10. Identifying different data sets with tables-4 Suppose you want to study factors that influence the body weight of the people in your city. You
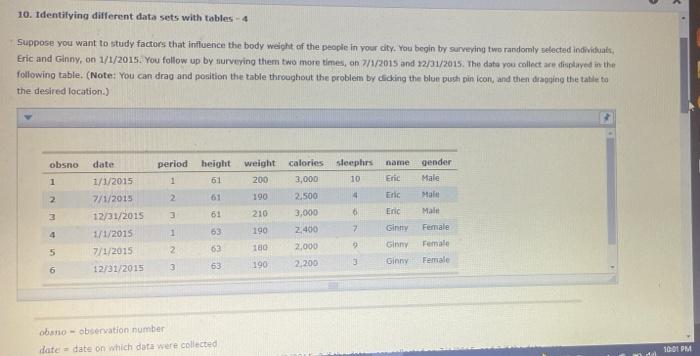
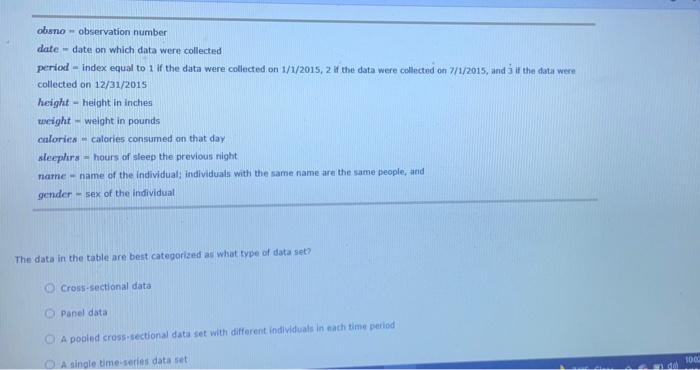
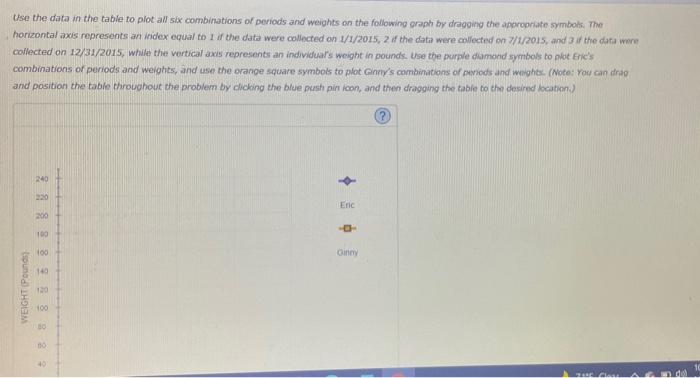
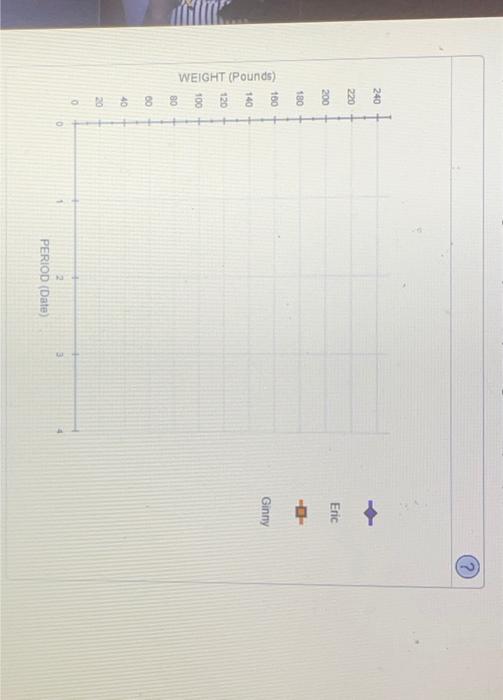
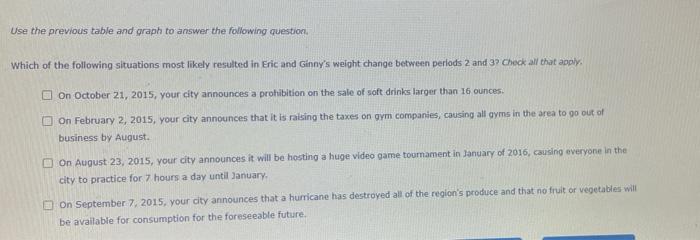
10. Identifying different data sets with tables-4 Suppose you want to study factors that influence the body weight of the people in your city. You begin by surveying two randomly selected individuals, Eric and Ginny, on 1/1/2015. You follow up by surveying them two more times, on 7/1/2015 and 12/31/2015. The data you collect are displayed in the following table. (Note: You can drag and position the table throughout the problem by clicking the blue push pin icon, and then dragging the table to the desired location.) obsno date period height weight calories sleephrs name gender 1 1/1/2015 1 200 3,000 10 Eric Male 2 7/1/2015 2 2,500 4 Eric Male 3 12/31/2015 3 3,000 6 Eric Male 4 1/1/2015 Female 2,400 1 7 Ginny 5 9 Female 2,000 2 Ginny 7/1/2015 Ginny Female 3 2,200 3 63 6 12/31/2015 obano observation number date date on which data were collected 533338 61 61 61 63 63 190 210 190 180 190 10:01 PM obsno observation number date date on which data were collected period index equal to 1 if the data were collected on 1/1/2015, 2 if the data were collected on 7/1/2015, and 3 if the data were collected on 12/31/2015 height -height in inches weight weight in pounds P calories calories consumed on that day sleephrs hours of sleep the previous night name name of the individual; individuals with the same name are the same people, and gender-sex of the individual The data in the table are best categorized as what type of data set? Cross-sectional data Panel data O A pooled cross-sectional data set with different individuals in each time period OA single time-series data set 1002 Use the data in the table to plot all six combinations of periods and weights on the following graph by dragging the appropriate symbols. The horizontal axis represents an index equal to 1 if the data were collected on 1/1/2015, 2 if the data were collected on 7/1/2015, and 3 if the data were collected on 12/31/2015, while the vertical axis represents an individual's weight in pounds. Use the purple diamond symbols to plot Eric's combinations of periods and weights, and use the orange square symbols to plot Ginny's combinations of periods and weights. (Note: You can drag and position the table throughout the problem by clicking the blue push pin icon, and then dragging the table to the desired location.) 240 220 Eric 200 100 100 Ginny 140 120 100 BO BO 40 WEIGHT (Pounds) WEIGHT (Pounds) 0. 2 PERIOD (Date) m Eric H Ginny Use the previous table and graph to answer the following question. Which of the following situations most likely resulted in Eric and Ginny's weight change between periods 2 and 3? Check all that apply. On October 21, 2015, your city announces a prohibition on the sale of soft drinks larger than 16 ounces. On February 2, 2015, your city announces that it is raising the taxes on gym companies, causing all gyms in the area to go out of business by August. On August 23, 2015, your city announces it will be hosting a huge video game tournament in January of 2016, causing everyone in the city to practice for 7 hours a day until January. On September 7, 2015, your city announces that a hurricane has destroyed all of the region's produce and that no fruit or vegetables will be available for consumption for the foreseeable future