

Question: (10 marks) Figure 1 and Figure 2 in Chapter 5 of the textbook show the correlation between inflation and unemployment in the U.S. in different
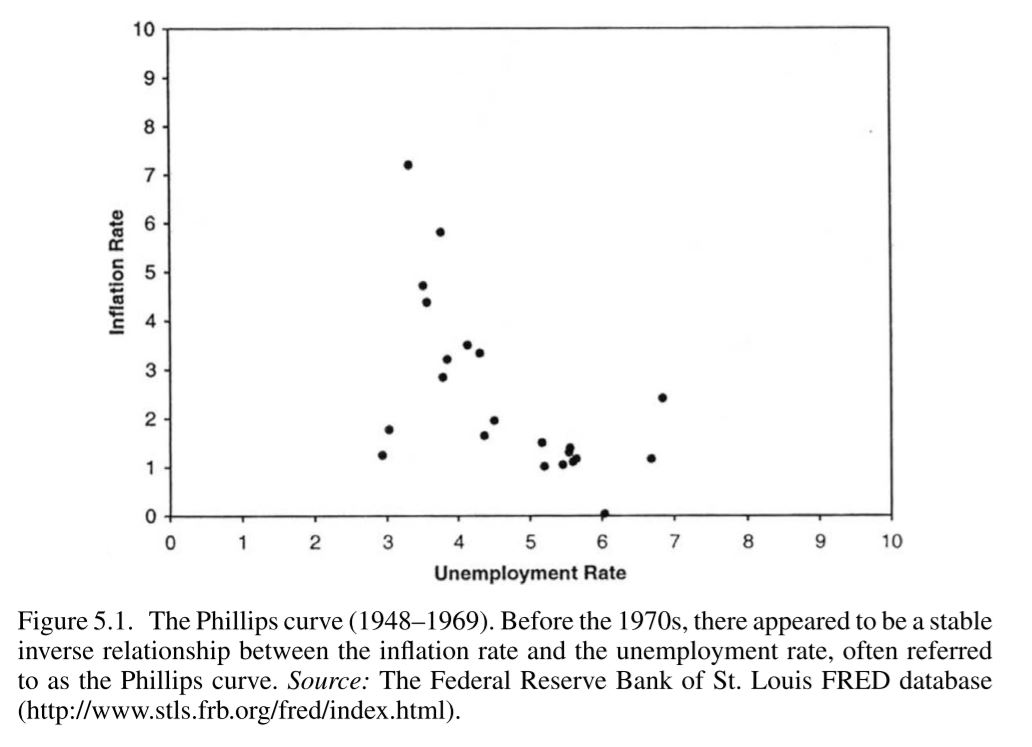
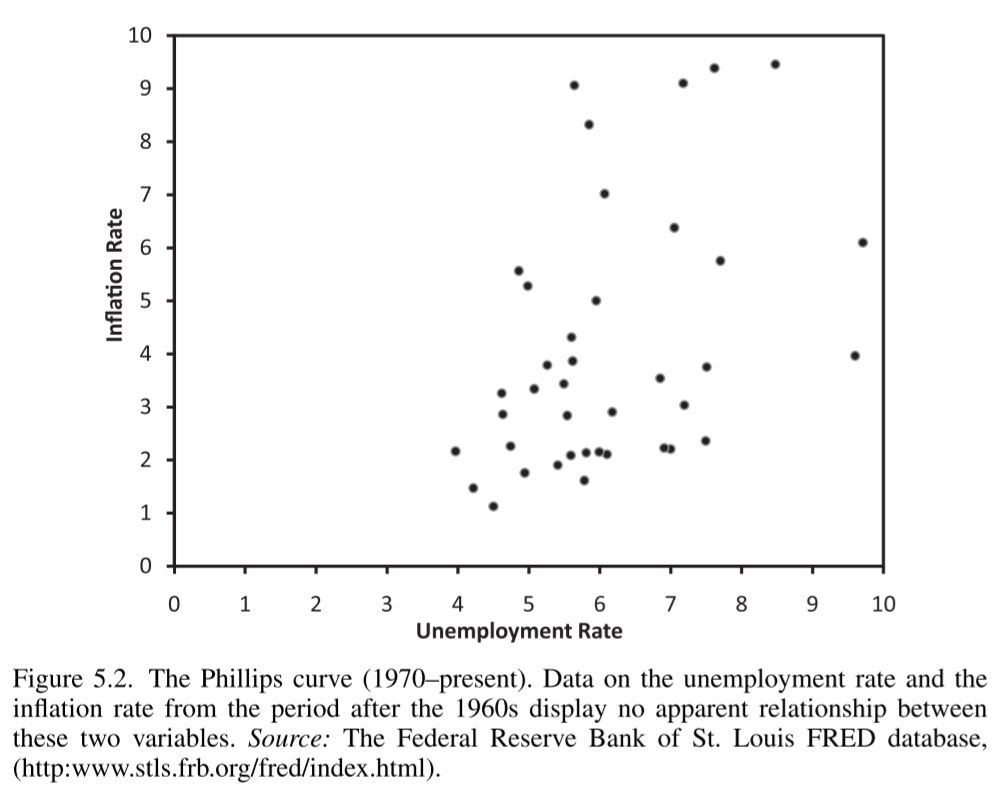
(10 marks) Figure 1 and Figure 2 in Chapter 5 of the textbook show the correlation between inflation and unemployment in the U.S. in different periods of time. Find data on inflation and unemployment in Australia. Annual frequency data is fine, but you can use quarterly frequency if you prefer. In your answer, please indicate the source of your data.
(a) Can you find an episode where there is a positive correlation between inflation and unemployment? If so, plot the data. Use a theory that we develop in class to justify the positive correlation.
(b) Can you also find an episode where there is a negative correlation between inflation and unemployment? If so, plot the data. Use a theory that we develop in class to justify the negative correlation.
Step by Step Solution
There are 3 Steps involved in it

Get step-by-step solutions from verified subject matter experts