

Question: (10 marks) Suppose you are working as data scientist for the Deputy Premier and Min- ister for Education to the Victorian Parliament, the Hon. James
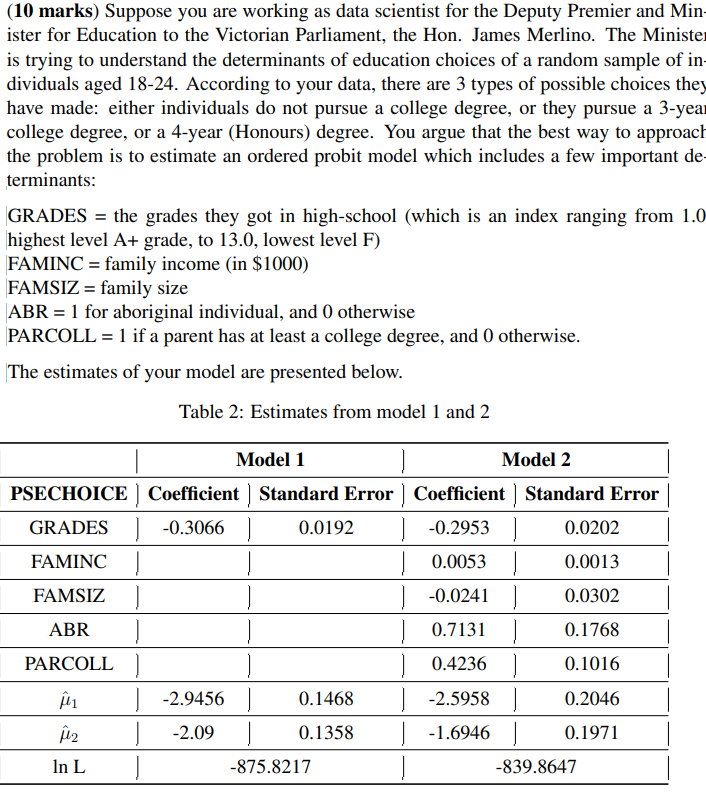
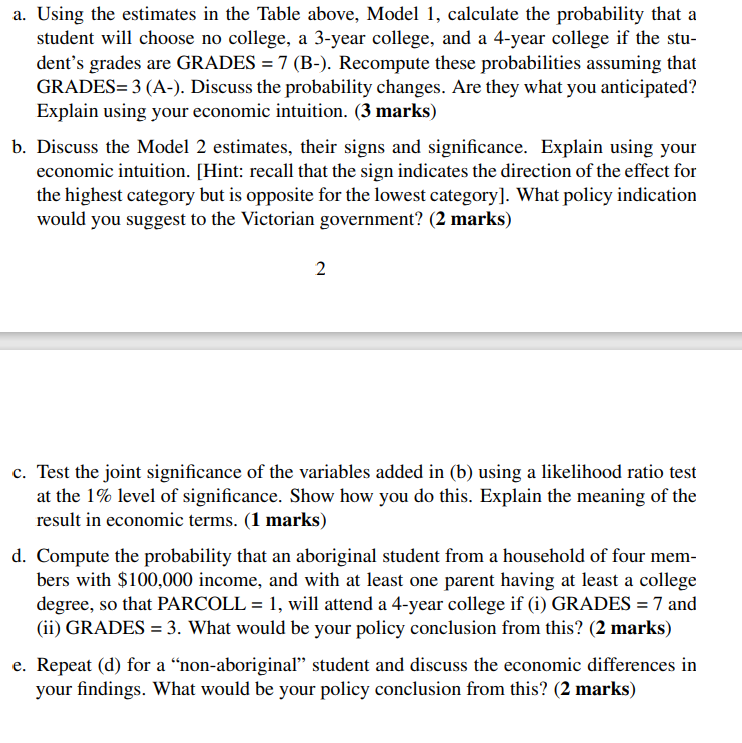
(10 marks) Suppose you are working as data scientist for the Deputy Premier and Min- ister for Education to the Victorian Parliament, the Hon. James Merlino. The Minister is trying to understand the determinants of education choices of a random sample of in dividuals aged 18-24. According to your data, there are 3 types of possible choices they have made: either individuals do not pursue a college degree, or they pursue a 3-year college degree, or a 4-year (Honours) degree. You argue that the best way to approach the problem is to estimate an ordered probit model which includes a few important de terminants: GRADES = the grades they got in high-school (which is an index ranging from 1.0 highest level A+ grade, to 13.0, lowest level F) FAMINC = family income (in $1000) FAMSIZ = family size ABR = 1 for aboriginal individual, and 0 otherwise PARCOLL = 1 if a parent has at least a college degree, and 0 otherwise. The estimates of your model are presented below. Table 2: Estimates from model 1 and 2 Model 1 Model 2 PSECHOICE ) Coefficient ) Standard Error ) Coefficient ) Standard Error GRADES ] -0.3066 0.0192 1 -0.2953) 0.0202 FAMINC] 0.0053 0.0013 FAMSIZ 1 -0.0241) 0.0302 ABR 10.7131 0.1768 PARCOLL 0.4236 0.1016 W1 | -2.9456 ] 0.1468 | -2.5958) 0.2046 2 -2.09 0.1358 -1.6946 ] 0.1971 In L -875.8217 -839.8647 a. Using the estimates in the Table above, Model 1, calculate the probability that a student will choose no college, a 3-year college, and a 4-year college if the stu- dent's grades are GRADES = 7 (B-). Recompute these probabilities assuming that GRADES= 3 (A-). Discuss the probability changes. Are they what you anticipated? Explain using your economic intuition. (3 marks) b. Discuss the Model 2 estimates, their signs and significance. Explain using your economic intuition. [Hint: recall that the sign indicates the direction of the effect for the highest category but is opposite for the lowest category]. What policy indication would you suggest to the Victorian government? (2 marks) 2 c. Test the joint significance of the variables added in (b) using a likelihood ratio test at the 1% level of significance. Show how you do this. Explain the meaning of the result in economic terms. (1 marks) d. Compute the probability that an aboriginal student from a household of four mem- bers with $100,000 income, and with at least one parent having at least a college degree, so that PARCOLL = 1, will attend a 4-year college if (i) GRADES = 7 and (ii) GRADES = 3. What would be your policy conclusion from this? (2 marks) e. Repeat (d) for a non-aboriginal student and discuss the economic differences in your findings. What would be your policy conclusion from this? (2 marks) (10 marks) Suppose you are working as data scientist for the Deputy Premier and Min- ister for Education to the Victorian Parliament, the Hon. James Merlino. The Minister is trying to understand the determinants of education choices of a random sample of in dividuals aged 18-24. According to your data, there are 3 types of possible choices they have made: either individuals do not pursue a college degree, or they pursue a 3-year college degree, or a 4-year (Honours) degree. You argue that the best way to approach the problem is to estimate an ordered probit model which includes a few important de terminants: GRADES = the grades they got in high-school (which is an index ranging from 1.0 highest level A+ grade, to 13.0, lowest level F) FAMINC = family income (in $1000) FAMSIZ = family size ABR = 1 for aboriginal individual, and 0 otherwise PARCOLL = 1 if a parent has at least a college degree, and 0 otherwise. The estimates of your model are presented below. Table 2: Estimates from model 1 and 2 Model 1 Model 2 PSECHOICE ) Coefficient ) Standard Error ) Coefficient ) Standard Error GRADES ] -0.3066 0.0192 1 -0.2953) 0.0202 FAMINC] 0.0053 0.0013 FAMSIZ 1 -0.0241) 0.0302 ABR 10.7131 0.1768 PARCOLL 0.4236 0.1016 W1 | -2.9456 ] 0.1468 | -2.5958) 0.2046 2 -2.09 0.1358 -1.6946 ] 0.1971 In L -875.8217 -839.8647 a. Using the estimates in the Table above, Model 1, calculate the probability that a student will choose no college, a 3-year college, and a 4-year college if the stu- dent's grades are GRADES = 7 (B-). Recompute these probabilities assuming that GRADES= 3 (A-). Discuss the probability changes. Are they what you anticipated? Explain using your economic intuition. (3 marks) b. Discuss the Model 2 estimates, their signs and significance. Explain using your economic intuition. [Hint: recall that the sign indicates the direction of the effect for the highest category but is opposite for the lowest category]. What policy indication would you suggest to the Victorian government? (2 marks) 2 c. Test the joint significance of the variables added in (b) using a likelihood ratio test at the 1% level of significance. Show how you do this. Explain the meaning of the result in economic terms. (1 marks) d. Compute the probability that an aboriginal student from a household of four mem- bers with $100,000 income, and with at least one parent having at least a college degree, so that PARCOLL = 1, will attend a 4-year college if (i) GRADES = 7 and (ii) GRADES = 3. What would be your policy conclusion from this? (2 marks) e. Repeat (d) for a non-aboriginal student and discuss the economic differences in your findings. What would be your policy conclusion from this? (2 marks)
Step by Step Solution
There are 3 Steps involved in it

Get step-by-step solutions from verified subject matter experts