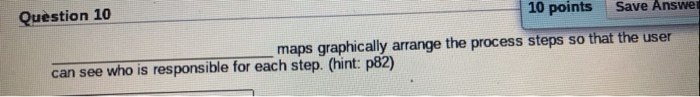
Question: 10 points Save Answer Question 10 maps graphically arrange the process steps so that the user can see who is responsible for each step. (hint:

10 points Save Answer Question 10 maps
10 points Save Answer Question 10 maps graphically arrange the process steps so that the user can see who is responsible for each step. (hint: p82) Question 8 10 points Save Answer Organizations often find it helpful to compare their business processes against of competitors or even other firms with similar processes. This activity is know as (hint: textbook p88) Question 6 10 points Save Answer has some basic training in Six Sigma methodology and tools and are assigned to projects on a part-time basis. (hint: p90) Question 5 10 points Save Answer graph is a graphical representation of data that places observations into specific categories. (hint: textbook p94)

Step by Step Solution

There are 3 Steps involved in it

1 Expert Approved Answer
Step: 1 Unlock blur-text-image
Question Has Been Solved by an Expert!

Get step-by-step solutions from verified subject matter experts

Step: 2 Unlock
Step: 3 Unlock

Students Have Also Explored These Related General Management Questions!