

Question: (10 pts) Consider the following MATLAB code. x=[0,1, 2, 3, 4, 4, 4, 3, 2, 1,0); t=tbegin:tincrement:tend: figure plot(t.x) hold plot(t.x,'r*) What are the values
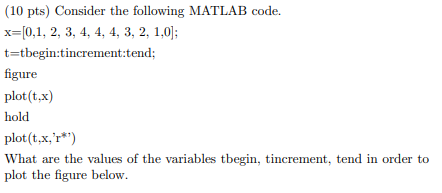
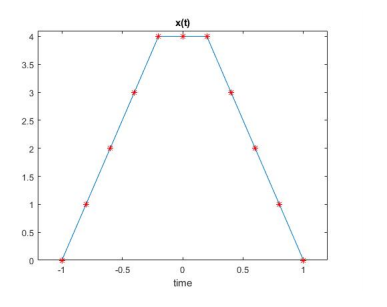
(10 pts) Consider the following MATLAB code. x=[0,1, 2, 3, 4, 4, 4, 3, 2, 1,0); t=tbegin:tincrement:tend: figure plot(t.x) hold plot(t.x,'r*) What are the values of the variables tbegin, tincrement, tend in order to plot the figure below. x(t) 3.5 2.5 N 1.5 0.5 0 -0.5 0.5 0 time
Step by Step Solution
There are 3 Steps involved in it
1 Expert Approved Answer
Step: 1 Unlock

Question Has Been Solved by an Expert!
Get step-by-step solutions from verified subject matter experts
Step: 2 Unlock
Step: 3 Unlock