

Question: 10. Three methods were tested to determine which saved the most money for shoppers: coupons, store discount cards, or buying store names only. After adding
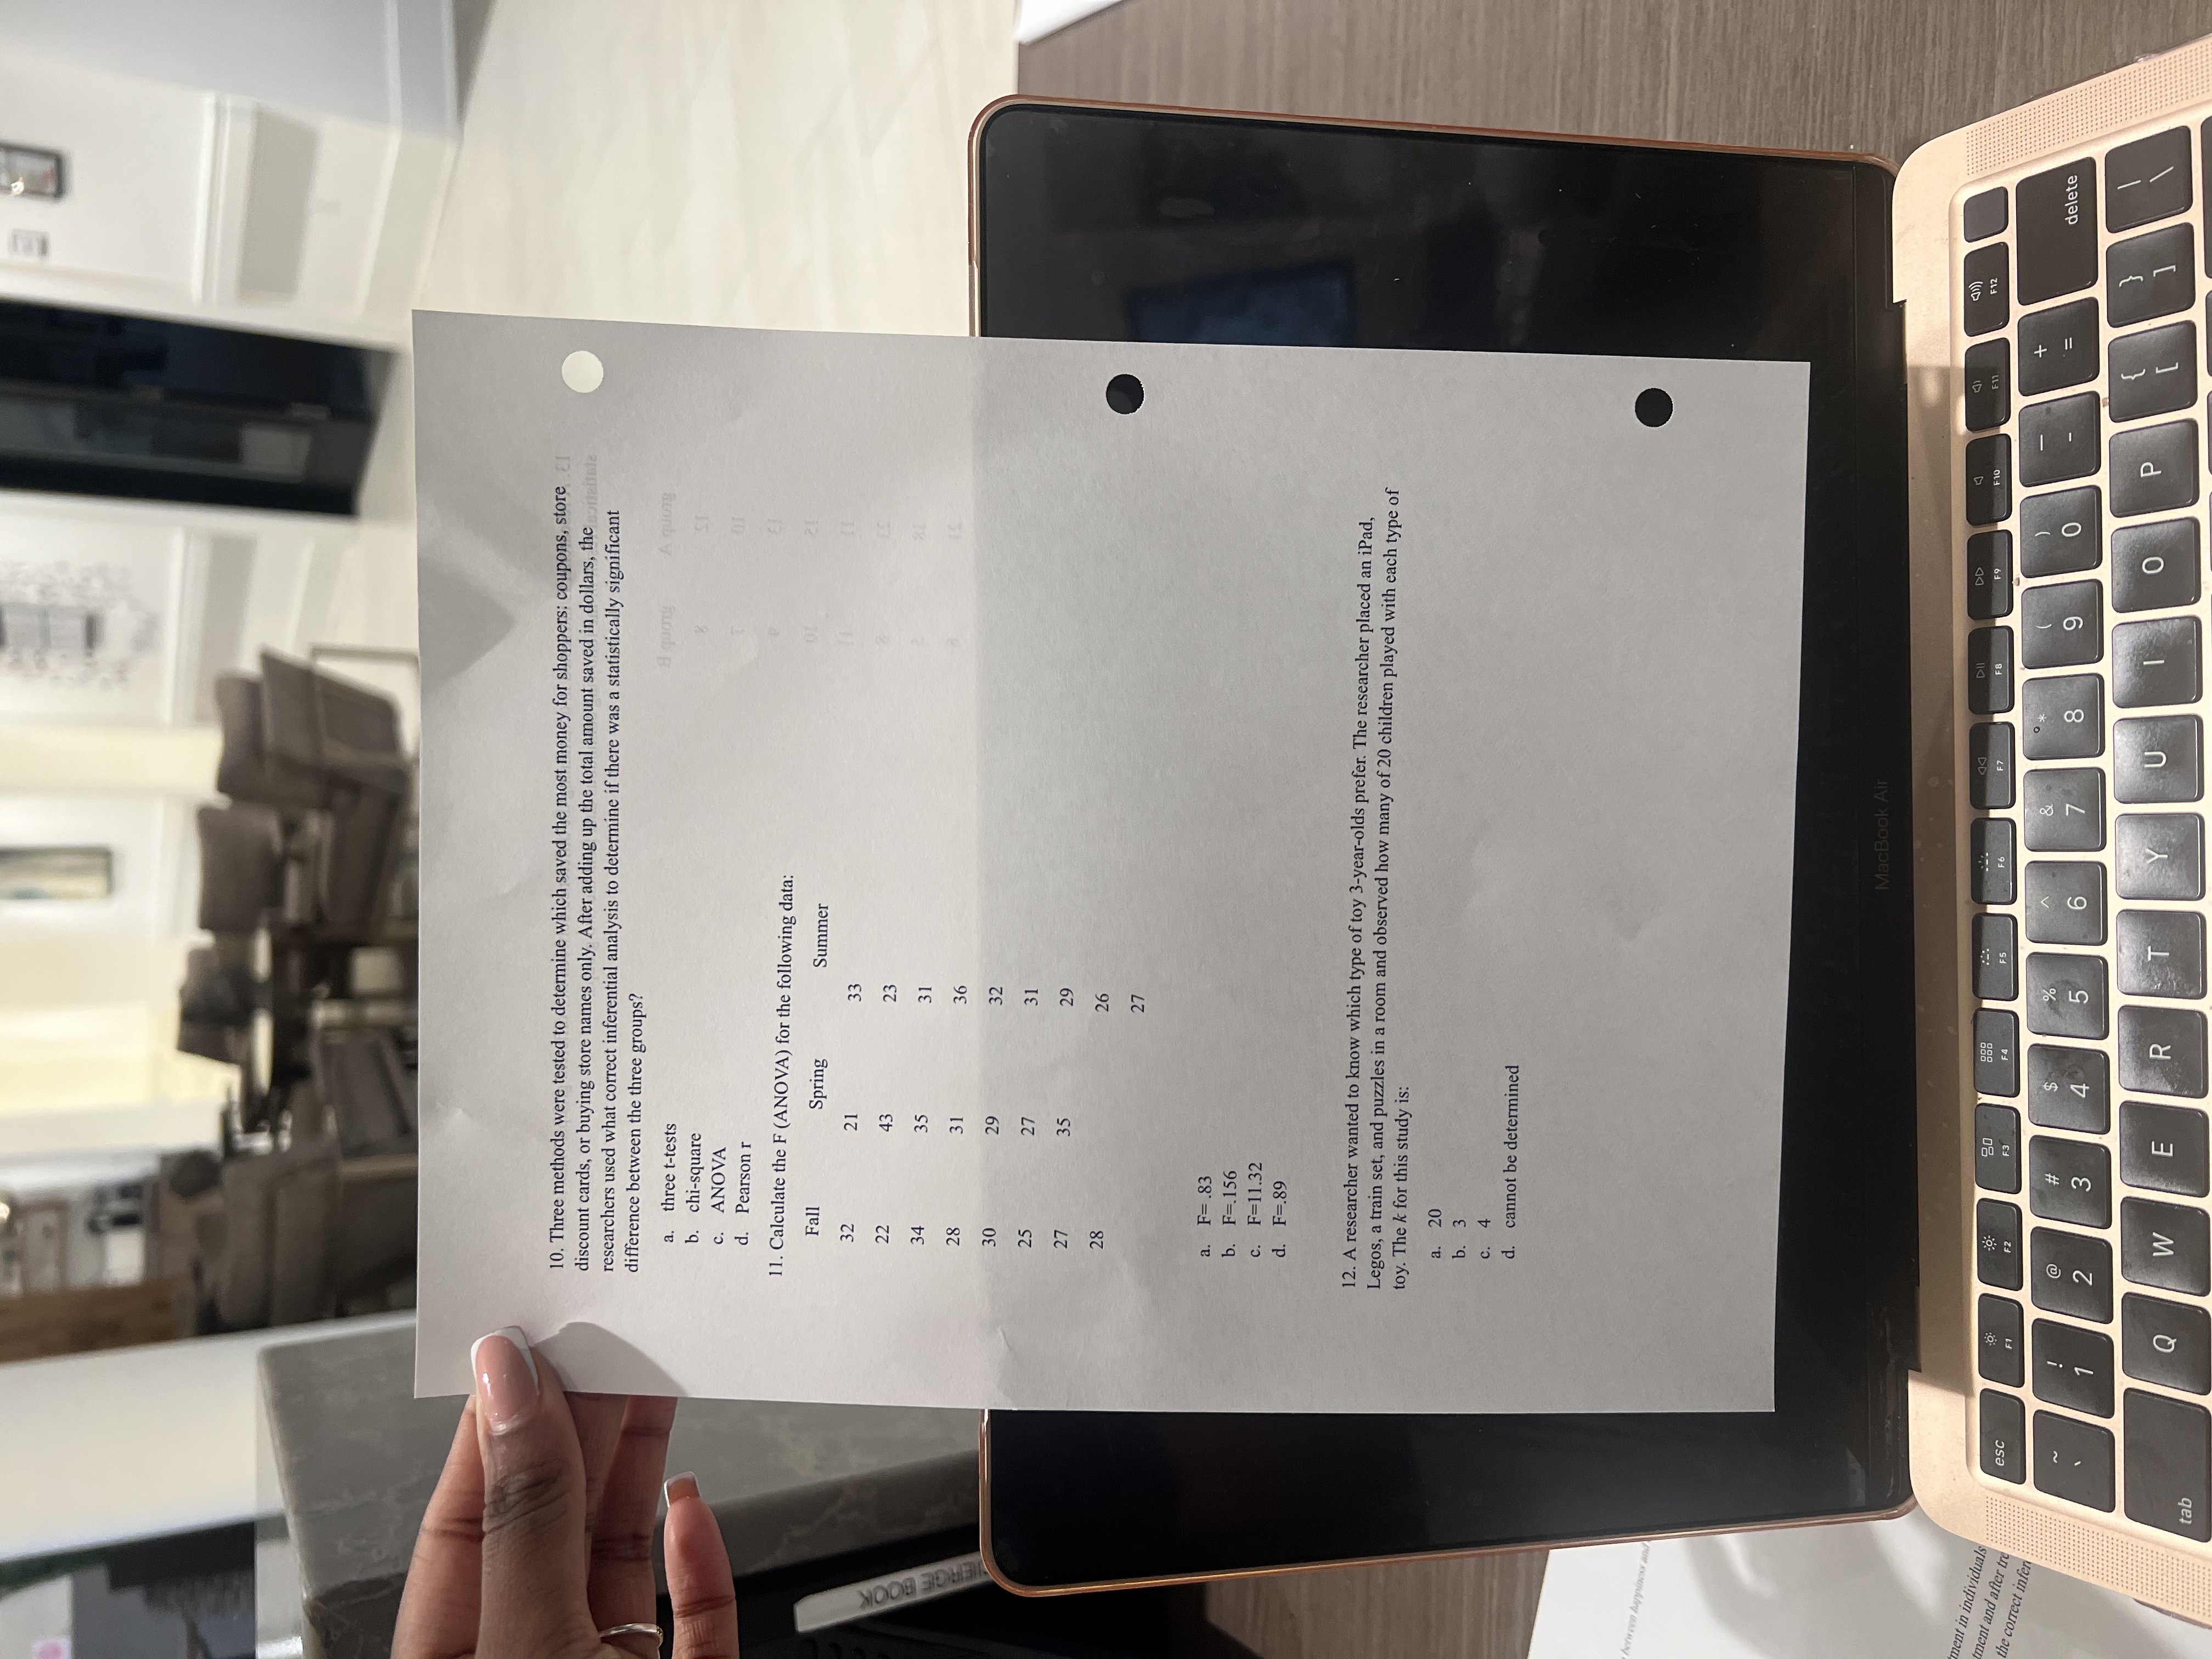
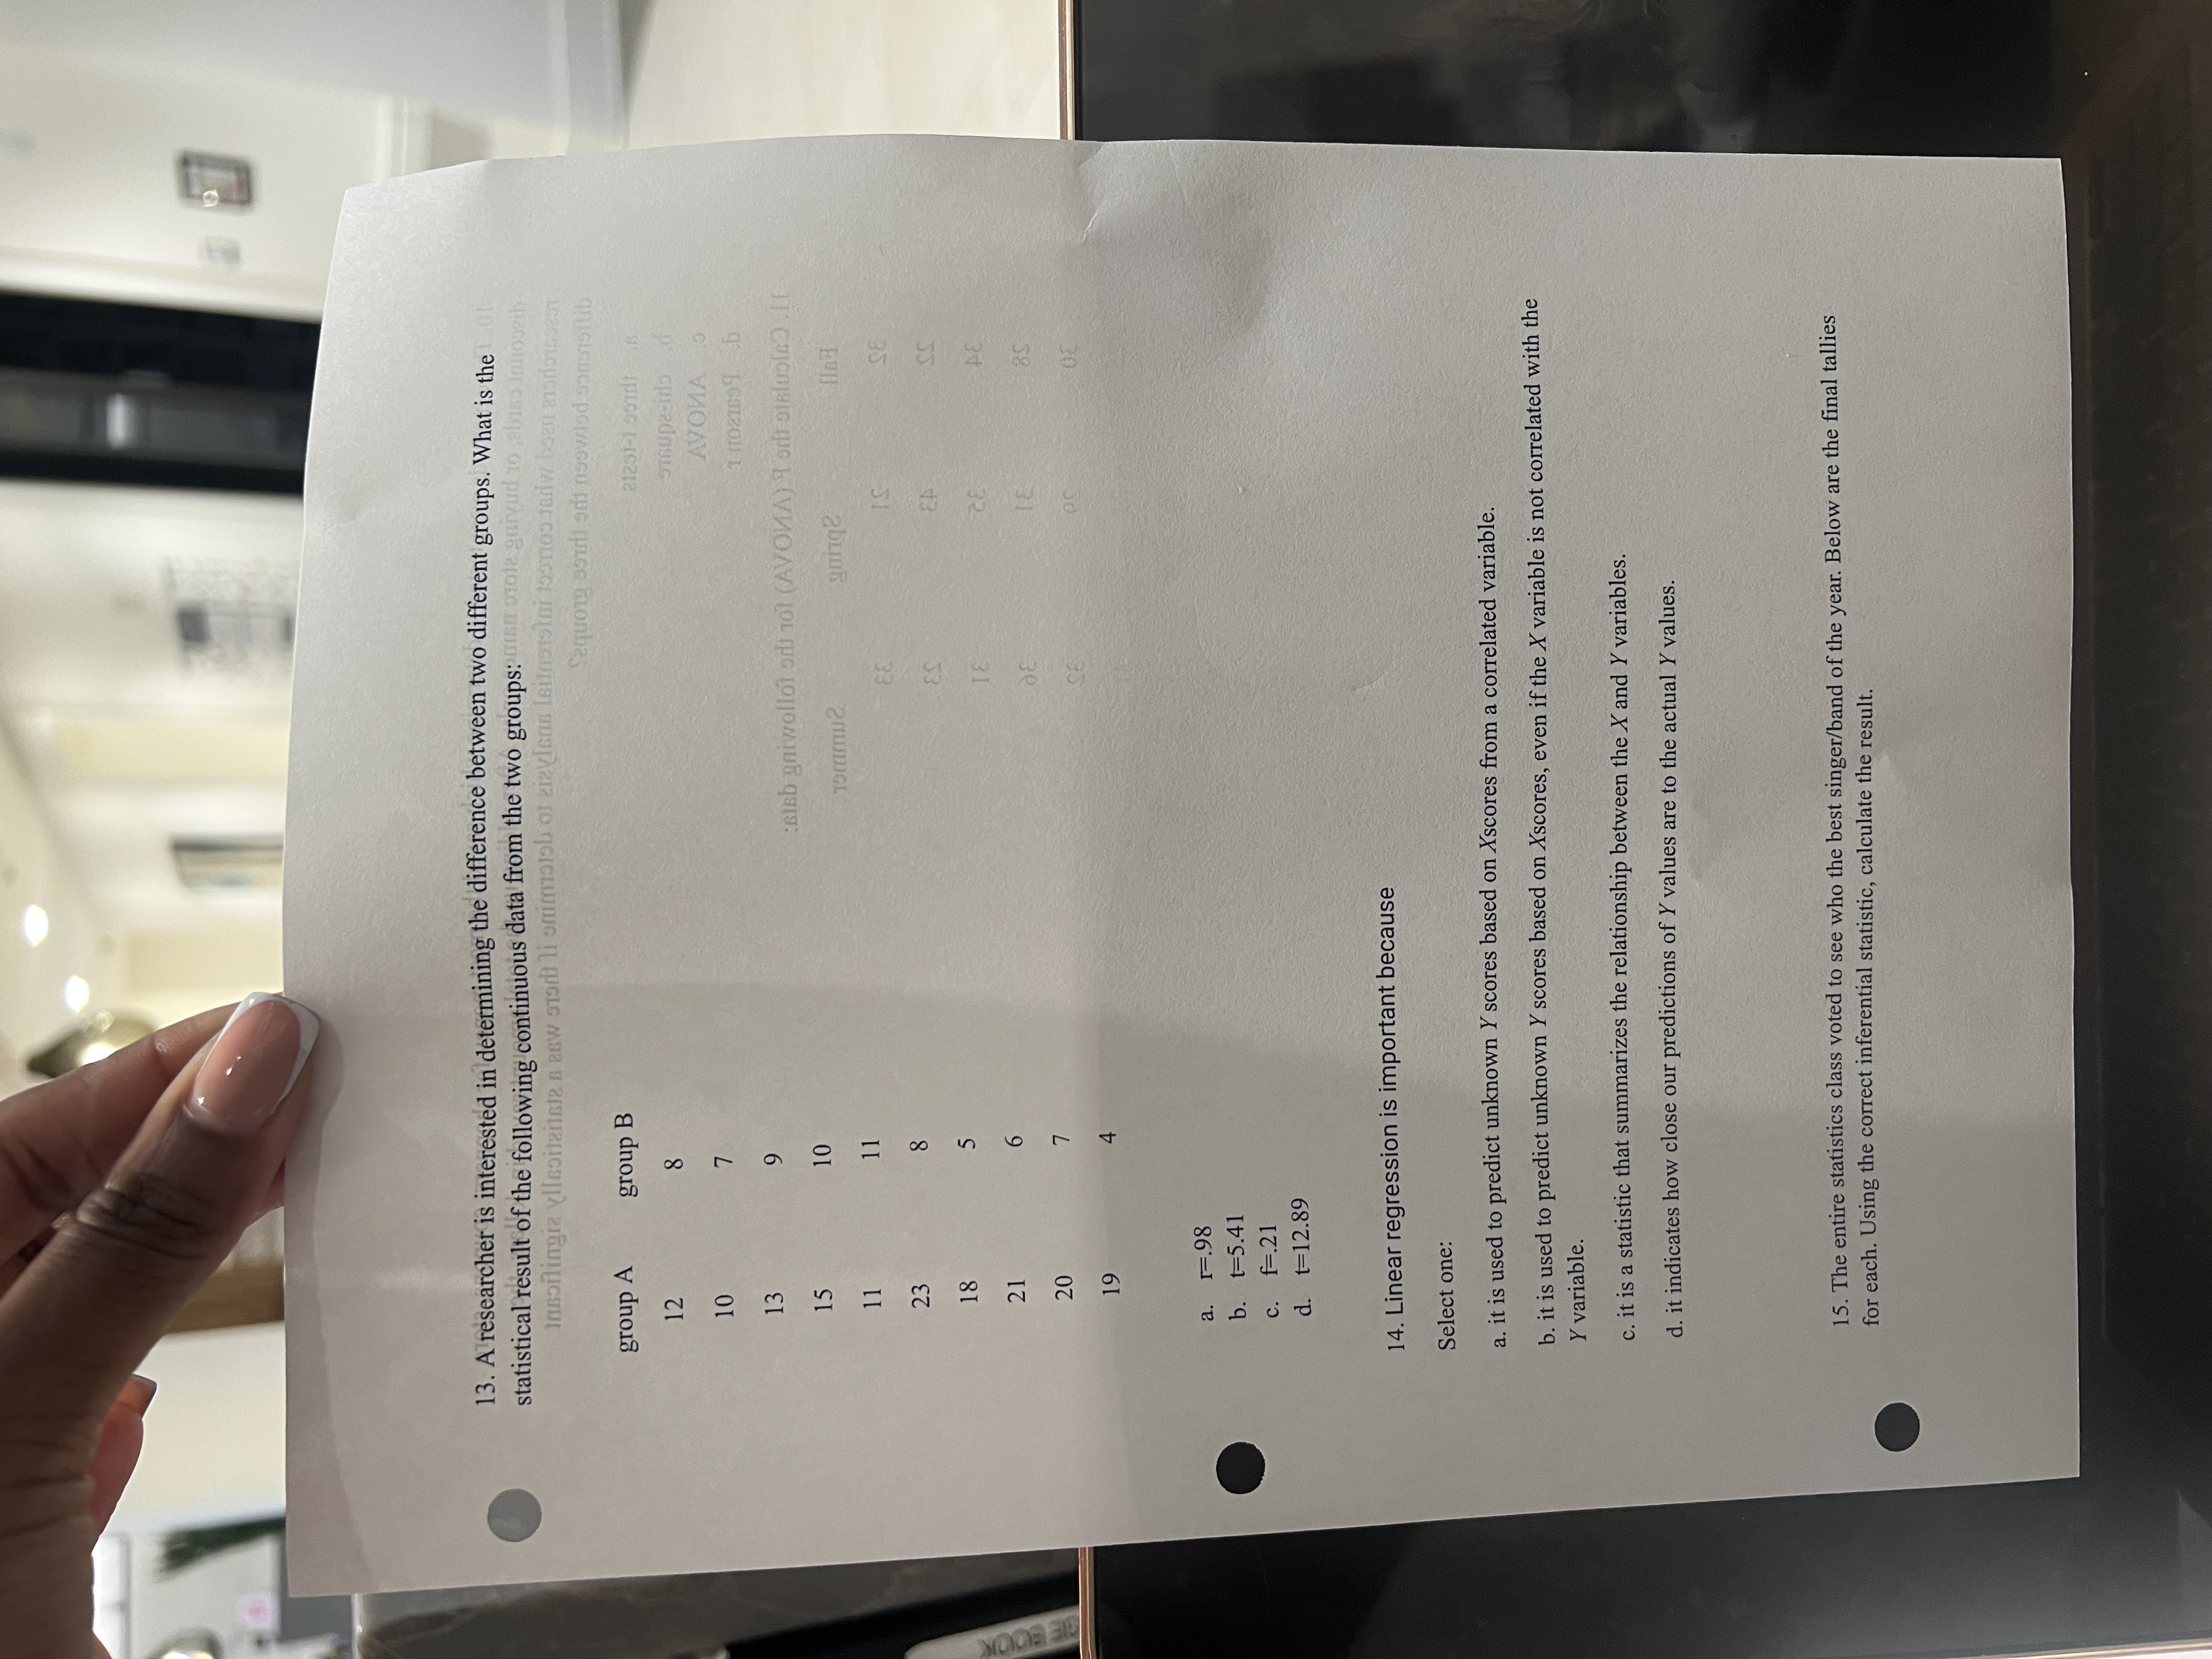
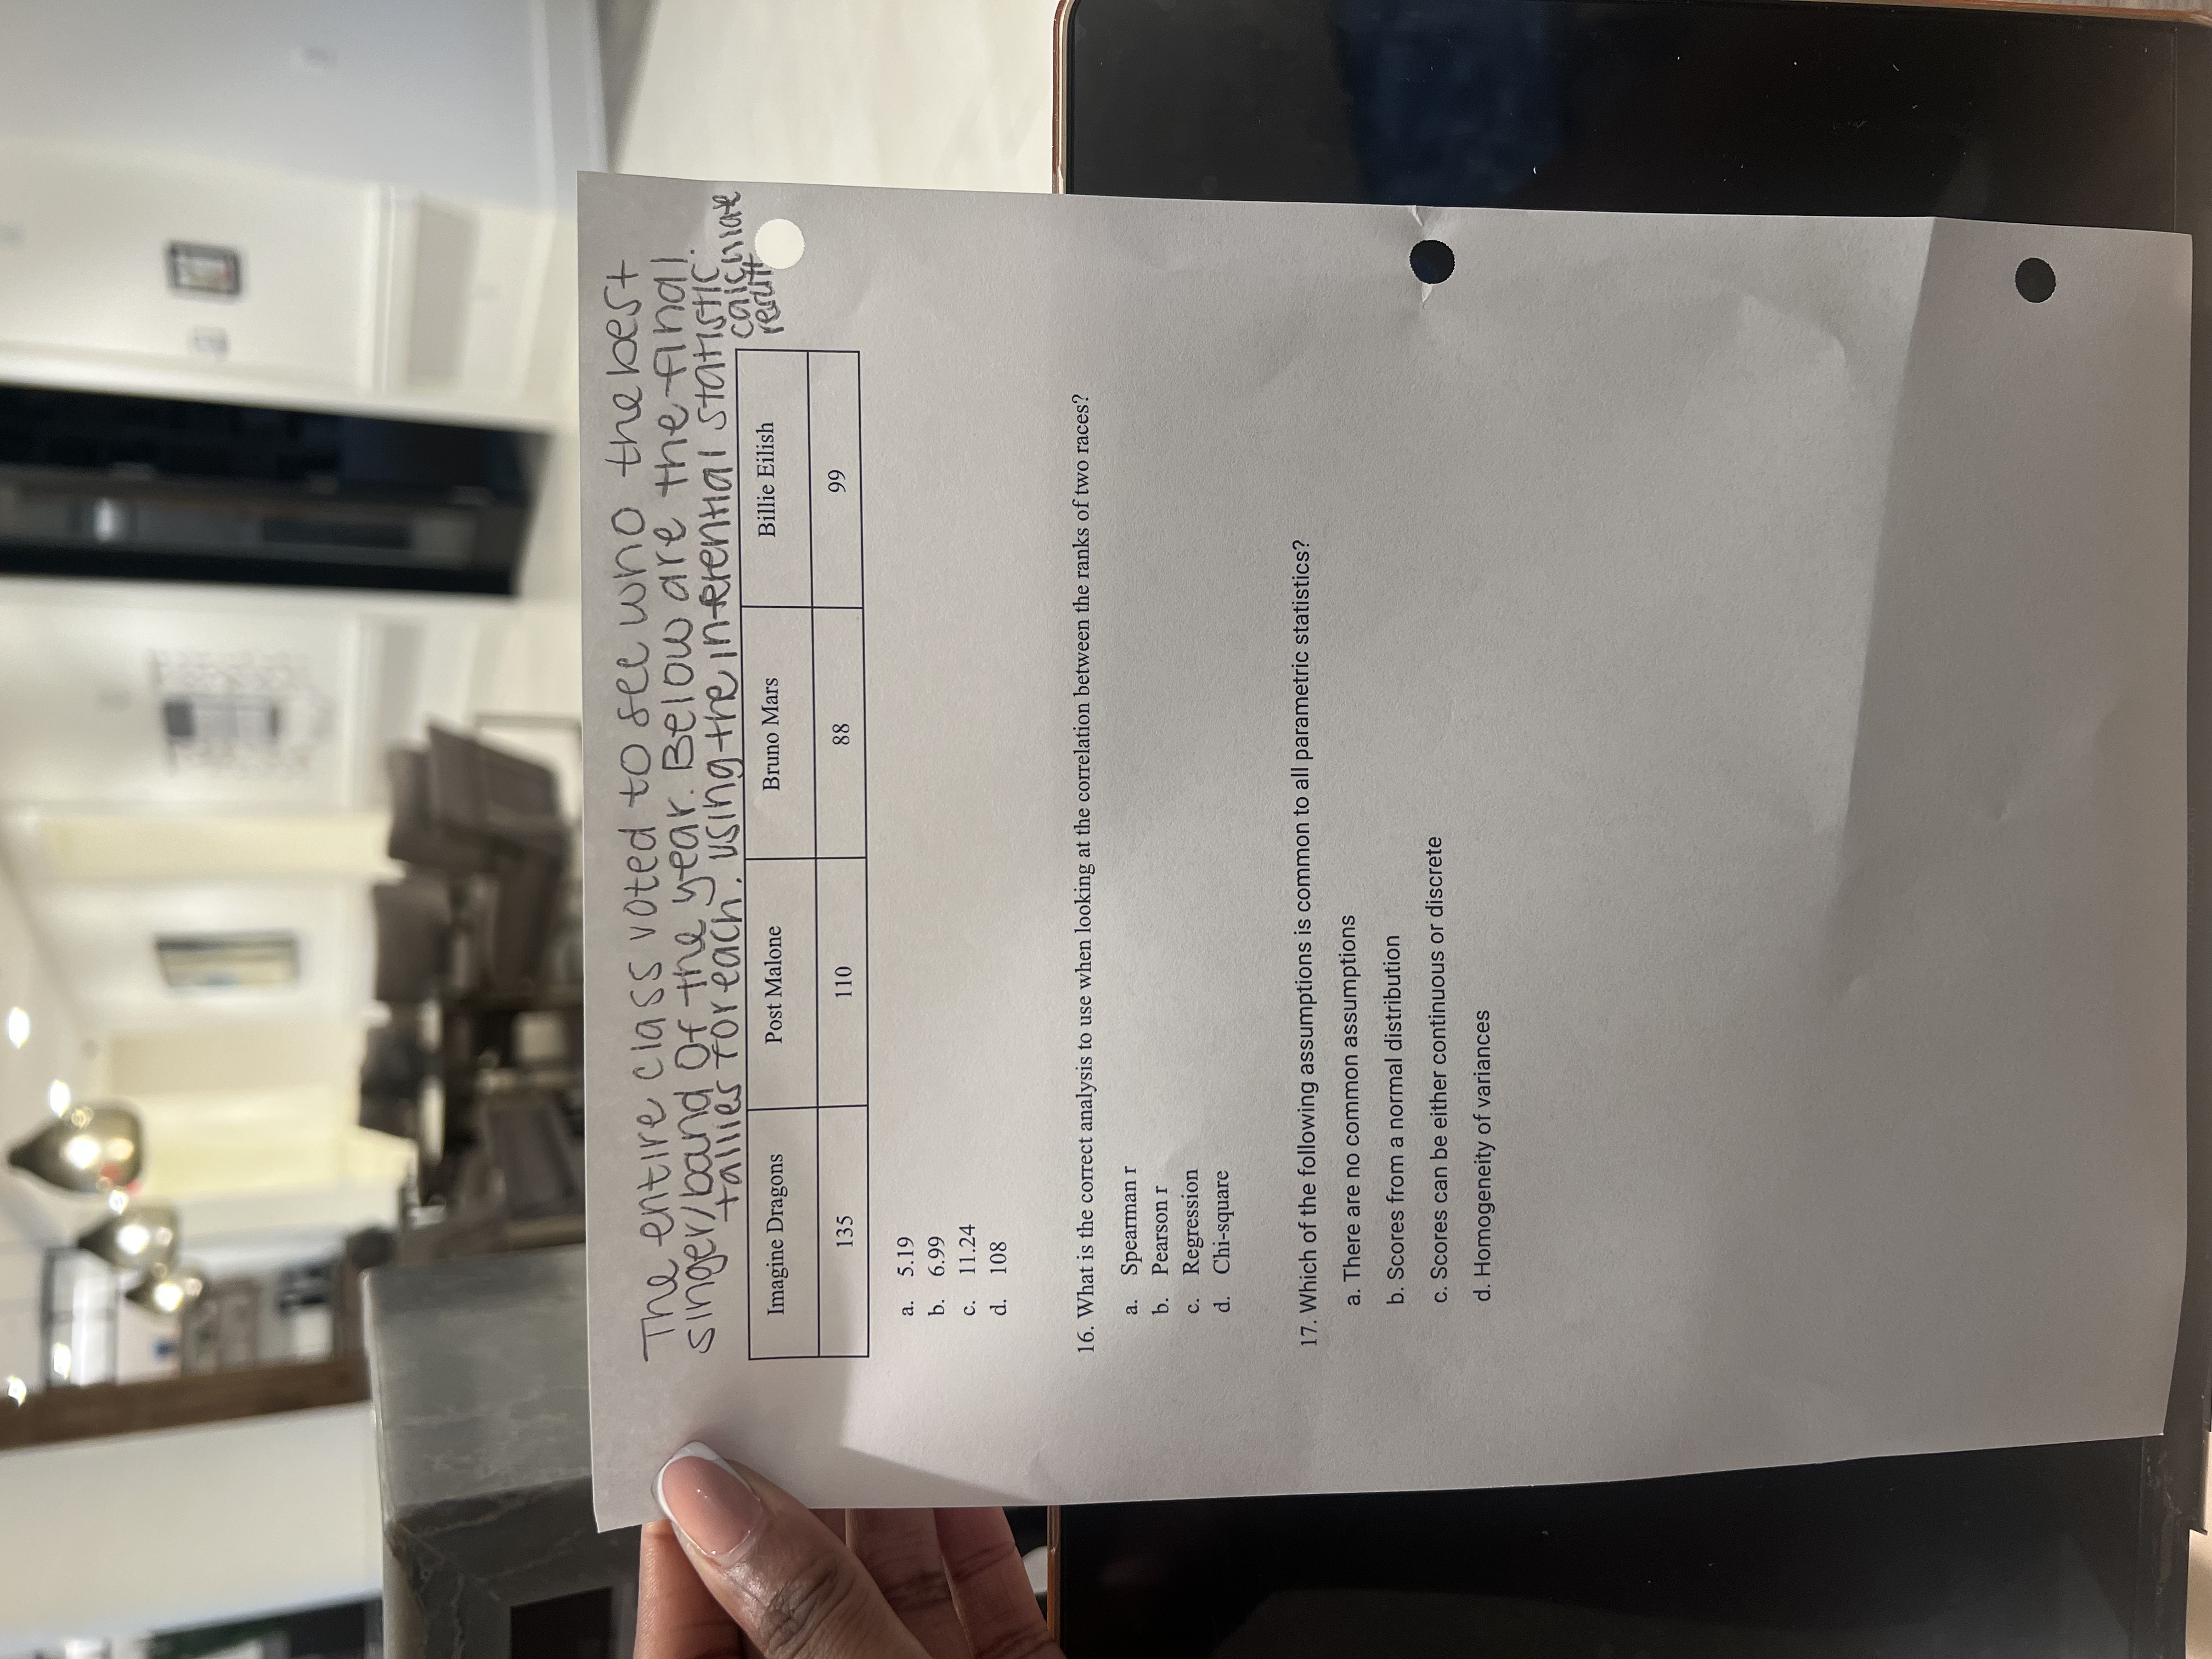
10. Three methods were tested to determine which saved the most money for shoppers: coupons, store discount cards, or buying store names only. After adding up the total amount saved in dollars, the researchers used what correct inferential analysis to determine if there was a statistically significant difference between the three groups? A quorg a. three t-tests b. chi-square c. ANOVA Pearson 11. Calculate the F (ANOVA) for the following data: Fall Spring Summer 32 21 33 22 to 23 34 35 31 MERGE BOOK 28 31 36 30 29 32 25 27 31 27 35 29 28 26 27 F= .83 F = 156 F= 11.32 d. F=.89 12. A researcher wanted to know which type of toy 3-year-olds prefer. The researcher placed an iPad, Legos, a train set, and puzzles in a room and observed how many of 20 children played with each type of toy. The k for this study is: a. 20 b. 3 C. 4 d. cannot be determined MacBook Air DII DD FO F7 838 FS F6 ment in individuals 80 11 + o* delete ment and after tre esc O the correct infer W# O P m Q tal13. A researcher is interested in determining the difference between two different groups. What is the statistical result of the following continuous data from the two groups: in pole garud. Inngoeth Sequong soull ert noswind songisflib group A group B 21201-1 9971 12 8 10 7 AVONA I noars 1 b 13 9 sieb gniwollot ord To1 (AVONA) Tord sialuoled . It 15 10 11 11 IS 23 ES SS 18 21 HE COOK 18 8S 20 19 a. 1=.98 b. 1 = 5.41 c. f=.21 d. 1=12.89 14. Linear regression is important because Select one: a. it is used to predict unknown Y scores based on Ascores from a correlated variable. b. it is used to predict unknown Y scores based on Xscores, even if the X variable is not correlated with the Y variable. c. it is a statistic that summarizes the relationship between the X and Y variables. d. it indicates how close our predictions of Y values are to the actual Y values. 15. The entire statistics class voted to see who the best singer/band of the year. Below are the final tallies for each. Using the correct inferential statistic, calculate the result.The entire class voted to see who the best singer/ band of the year. Below are the final tallies Foreach. using the in-erential statistic calculate Imagine Dragons Post Malone Bruno Mars Billie Eilish result 135 110 88 99 a. 5.19 . 6.99 C. 11.24 d. 108 16. What is the correct analysis to use when looking at the correlation between the ranks of two races? a. Spearman r b. Pearson I c. Regression d. Chi-square 17. Which of the following assumptions is common to all parametric statistics? a. There are no common assumptions p. Scores from a normal distribution c. Scores can be either continuous or discrete d. Homogeneity of variances
Step by Step Solution
There are 3 Steps involved in it

Get step-by-step solutions from verified subject matter experts