

Question: 10. Use the given frequency distribution to approximate the mean. 11. The following data set represents the amount of spending for a dinner. 43 13
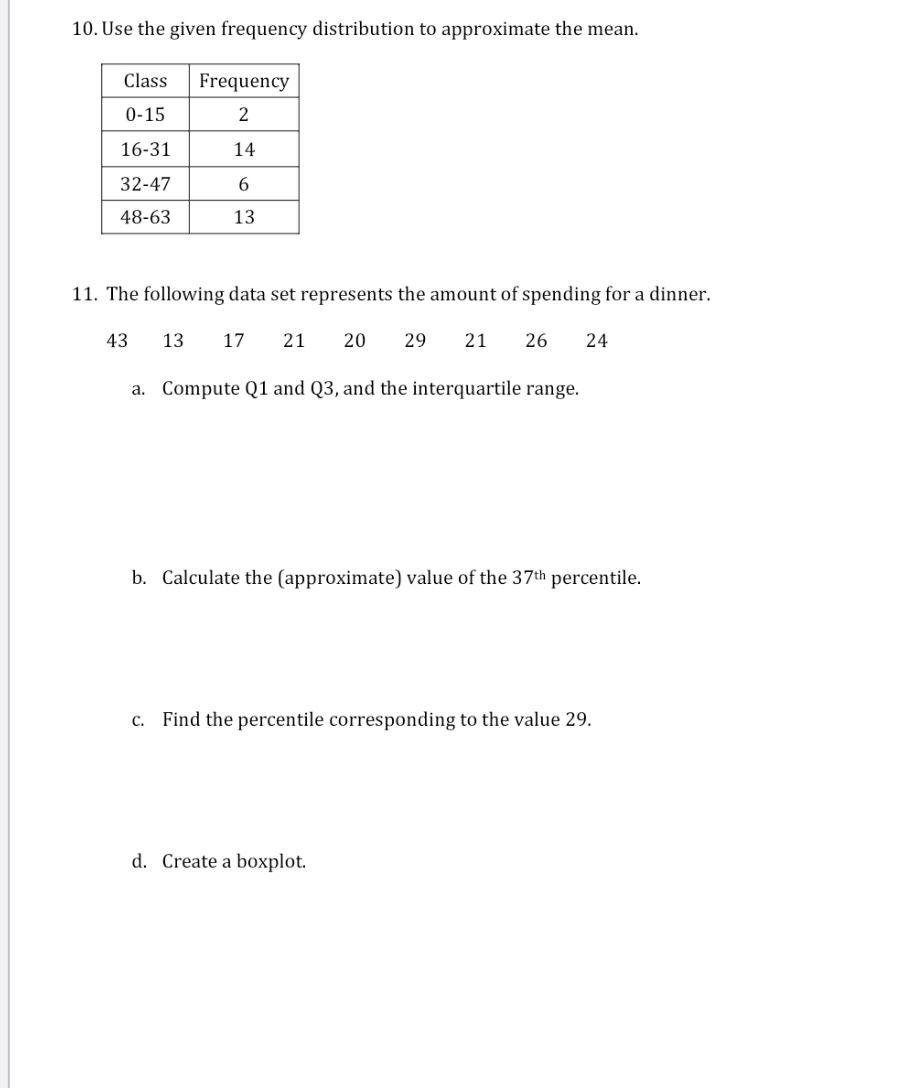
10. Use the given frequency distribution to approximate the mean. 11. The following data set represents the amount of spending for a dinner. 43 13 17 21 20 29 21 26 24 a. Compute Q1 and Q3, and the interquartile range. b. Calculate the [approximate]; value of the 37th percentile. c. Find the percentile corresponding to the value 29. d. Create a boxplot
Step by Step Solution
There are 3 Steps involved in it
1 Expert Approved Answer
Step: 1 Unlock

Question Has Been Solved by an Expert!
Get step-by-step solutions from verified subject matter experts
Step: 2 Unlock
Step: 3 Unlock