

Question: 100% + E3 T View Zoom Add Page Insert Table Chart Text Shape Media Comment Collaborate Format Document 1. All new-born children are weighed at
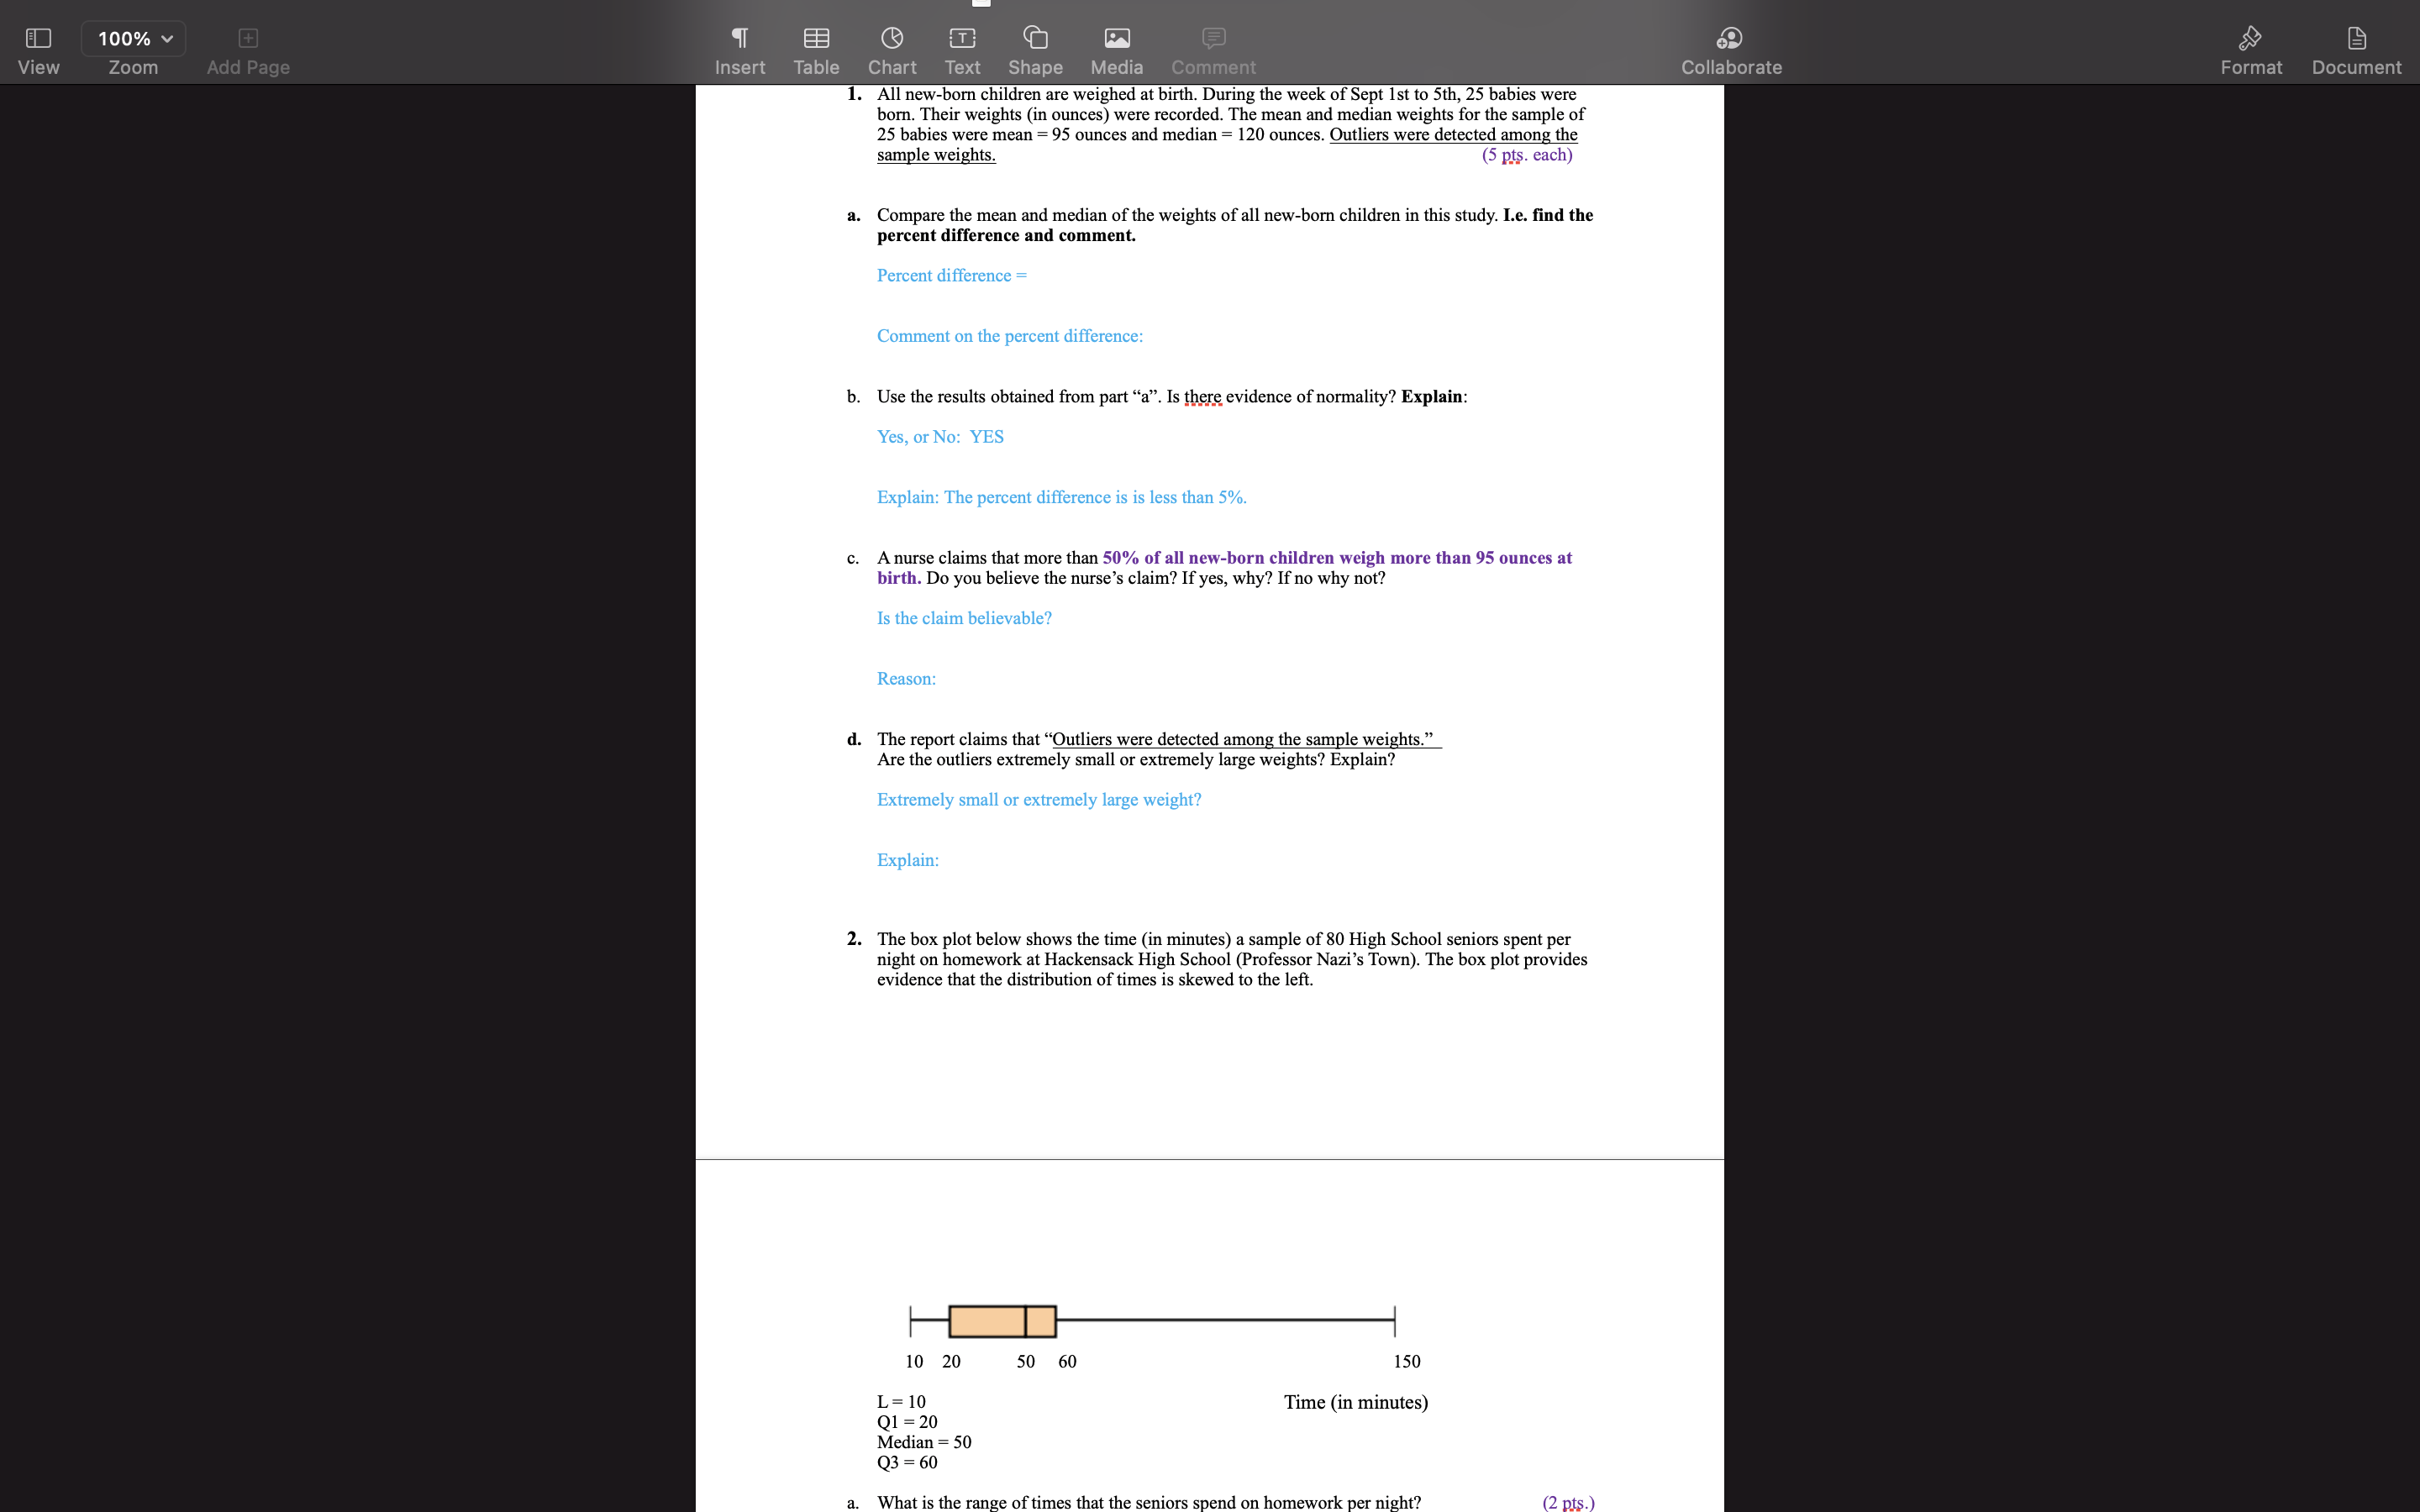
100% + E3 T View Zoom Add Page Insert Table Chart Text Shape Media Comment Collaborate Format Document 1. All new-born children are weighed at birth. During the week of Sept 1st to 5th, 25 babies were born. Their weights (in ounces) were recorded. The mean and median weights for the sample of 25 babies were mean = 95 ounces and median = 120 ounces. Outliers were detected among the sample weights. (5 pts. each) a. Compare the mean and median of the weights of all new-born children in this study. I.e. find the percent difference and comment. Percent difference= Comment on the percent difference: b. Use the results obtained from part "a". Is there evidence of normality? Explain: Yes, or No: YES Explain: The percent difference is is less than 5%. c. A nurse claims that more than 50% of all new-born children weigh more than 95 ounces at birth. Do you believe the nurse's claim? If yes, why? If no why not? Is the claim believable? Reason: d. The report claims that "Outliers were detected among the sample weights." Are the outliers extremely small or extremely large weights? Explain? Extremely small or extremely large weight? Explain: 2. The box plot below shows the time (in minutes) a sample of 80 High School seniors spent per night on homework at Hackensack High School (Professor Nazi's Town). The box plot provides evidence that the distribution of times is skewed to the left. 10 20 50 60 150 L = 10 Time (in minutes) Q1 = 20 Median = 50 Q3 = 60
Step by Step Solution
There are 3 Steps involved in it

Get step-by-step solutions from verified subject matter experts